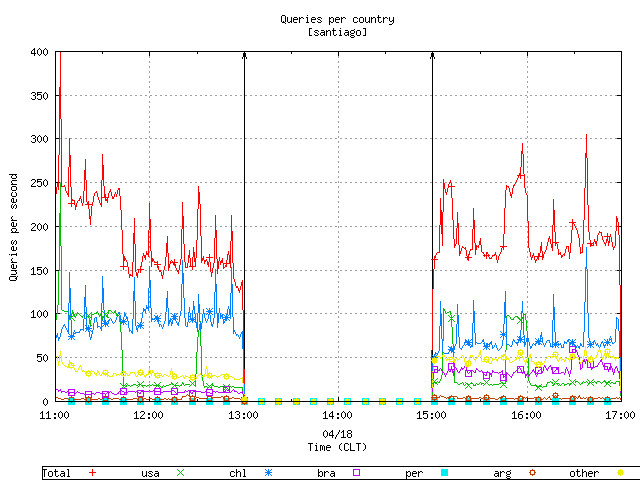
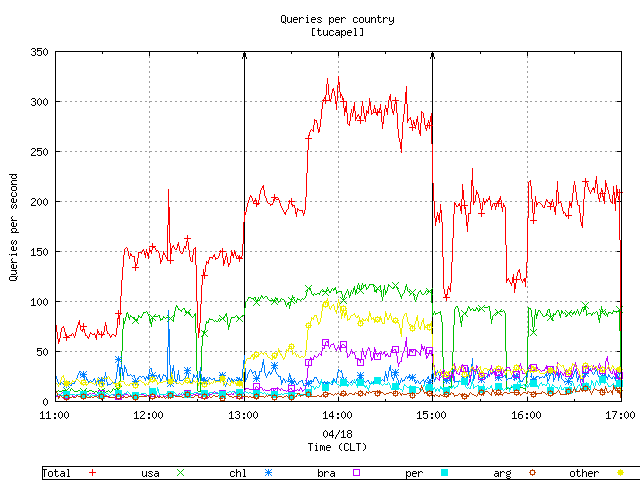
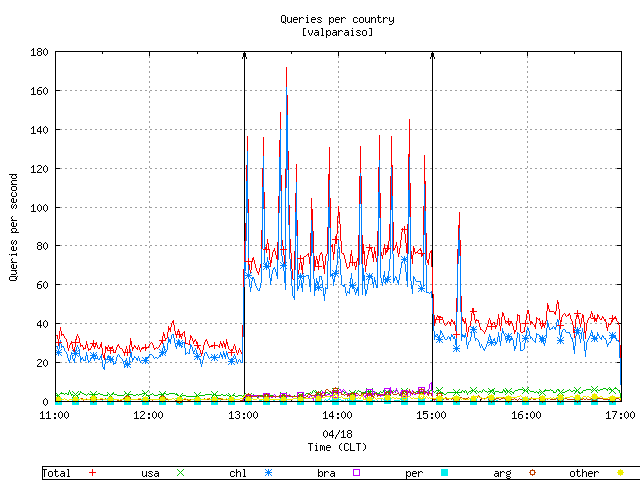
Figures 1, 2, and 3 below present a view of the query load aggregated by country. To avoid cluttering the graph with lines, we select the top five (5) countries and include the rest as "other".

Figure 1. The query load aggregated by country for the santiago node.

Figure 2. The query load aggregated by country for the tucapel node.

Figure 3. The query load aggregated by country for the valparaiso node.
![Go to CAIDA home page [CAIDA - Center for Applied Internet Data Analysis logo]](/images/caida_globe_faded.png)