RECIPIENT'S PROGRESS STATUS AND MANAGEMENT REPORT
Predictability and Security of High Performance Networks
For the period 01 July 2000 to 30 September 2000
Report #9
CDRL A001C
CONTRACT N66001-98-2-8922
October 31, 2000
SUBMITTED TO Receiving Officer
SPAWARSYSCEN - SAN DIEGO
e-mail address: spendlov@spawar.navy.mil
Richard Laverty
PHONE 619-553-2918
FAX 619-553-1690
laverty@spawar.navy.mil
Frank Schindler
PHONE 619-553-2845
FAX 619-553-1690
schindl@spawar.navy.mil
|
SUBMITTED BY
University of California, San Diego (UCSD)
9500 Gilman Drive
La Jolla, CA 92093
Principal Investigator
Dr. Kimberly Claffy
PHONE 858-534-8333
FAX 858-822-0861
kc@caida.org
Contract/Financial Contact
Lynnelle Gehrke
PHONE 858-534-0243
FAX 858-534-0280
lgehrke@ucsd.edu
|
Quarterly Status Report
Predictability and Security of High Performance Networks
For the period 01 July 2000 to 30 September 2000
Contract N66001-98-2-8922
CDRL A001
1.0 Purpose of
Report
This status report is the quarterly cooperative
agreement report (CDRL A001) which summarizes the effort expended by the UCSD's
Cooperative Association for Internet Data Analysis (CAIDA) program in support
of SPAWARSYSCEN-SAN DIEGO and DARPA on Agreement N66001-96-2-8922.
2.0 Project Members
UCSD utilized (07/01/00-09/30/00):
Dr. KC Claffy
129
David Moore
223
Other Staff
2792
Total Hours
3144
University of Waikato
actual hours unavailable(see financial information)
3.0 Project Description
UCSD/CAIDA is focusing on advancing the capacity
to monitor, depict, and predict
traffic behavior on current and advanced
networks, through developing and deploying tools to better engineer and operate
networks and to identify traffic anomalies in real time. CAIDA will concentrate
efforts in the development of tools to automate the discovery and visualization
of Internet topology and peering relationships, monitor and analyze Internet
traffic behavior on high speed links, detect and control resource use (security),
and provide for storage and analysis of data collected in aforementioned efforts.
4.0 Performance Against Plan
CAIDA was granted a one year no cost extension
to continue work on this award, which expands the official end date to July
15, 2001. Option 1 of this award was also obligated in April 2000. As a result
of the no-cost extension and re-budgeting of the remaining funds, the original
Tasks and schedule for completion have been re-defined as follows:
Task 1 still encompasses work on Coral OC48mon,
and has expanded to include work on the Gigabit Ethernet Monitor. Both of
these projects are scheduled for completion on or before July 15, 2001.
Option 1, obligated in April 2000, continues
to focus on the DNS Root Server Initiative and visualization of massive datasets.
It has been expanded to include additional work on the Tomography Task, originally
Task 2, and the Storage and Analysis Task, previously Task 4. Work on each
element of Option 1 is scheduled for completion on or before July 15, 2001.
Task 3, the original security task, has been
completed.
5.0 Major Accomplishments to Date
The following major accomplishments were
achieved during Year 3, Quarter 1:
The Waikato DAG development team completed
the design review of the Dag4.1 OC48 measurement board in early July, and
placed for prototypes. The prototype board was completed in August. Once this
board was tested and deemed to be functioning properly, construction of additional
boards commenced. Four working prototype Dag4.1 boards are ready for testing.
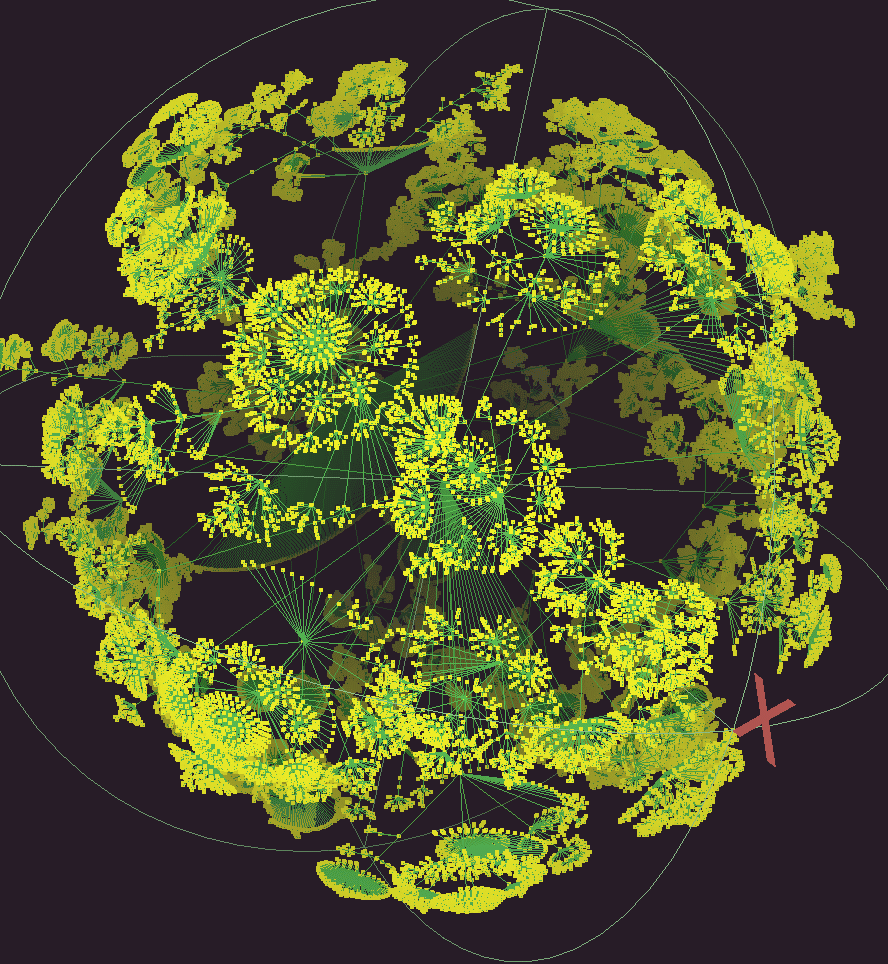
CAIDA did significant work on the 3-D hyperbolic
visualization tool, Walrus, this quarter. Walrus is a tool for visualizing
large directed graphs, where large is on the order of a few hundred thousand
nodes to a million nodes. It is applicable mainly to tree like- graphs with
a meaningful spanning tree and relatively few non-tree links. It addresses
the difficulties of visualizing such large graphs in several ways. The complexity
of layout is overcome by computing a layout based solely on the spanning tree,
since techniques for tree layout scale better than those for general graph
layout. The problem of displaying such a large number of nodes and links on
a small screen is overcome by making use of hyperbolic geometry to create
a Focus+Context view. This view resembles a continuous fish-eye distortion
(taken to three dimensions), and allows the user to examine the fine details
of a small area while always having the context of the whole graph available
as a frame of reference. Although the whole graph cannot be examined in full
detail at once, by interactively moving the focus over the graph, the user
is able to navigate the data more effectively.
|
|  |
(
Walrus visualization of data from lhr.skitter.org,
535,102 nodes, 60,1678 links, seehttps://www.caida.org/tools/visualization/walrus/ for complete image gallery)
We've used the Walrus tool to examine several
different datasets: A dataset from the skitter monitor champagne.caida.org
(9,175 nodes, 15,519 links [tree + non-tree]), riesling.caida.org, (54,893
nodes, 79,409 links), and the lhrskitter.caida.org host located in London,
(535,102 nodes, 601,678 links). We also used Walrus to visualize the routable
IPv4 class-C address space as seen in global BGP routing tables (1,463,418
nodes, 1,463,417 links), communication patterns between hosts taken from passive
trace data (16,709 nodes, 26,764 links), and web site directory hierarchies
(18,474 nodes, 18,473 links). See section 11.0, Work Focus, for additional
detail on this tool.
-CAIDA also made skitter data publicly available
to all interested researchers via a Certificate Authority on the CAIDA web
site. So far, we've made data available to researchers at MIT, UCLA, UIUC,
Arizona State, Network Solutions, Caimis, University of Washington, University
of Arizona, Telcordia, and Boston University. Each researcher signed an Acceptable
Use Policy in order to gain access the data, and agreed to report the results
of their research directly to CAIDA. This is the most extensive publicly available
resource for real macroscopic Internet topology data, which is vital to network
research in the community.
6.0 Artifacts Developed During the Past Quarter
No artifacts were developed this past quarter.
7.0 Issues
7.1 Open issues with no plan, as yet, for resolution
We had considerable difficulty contacting
our SPAWAR program manager over the last 5 months and were unable to schedule
or conduct our quarterly status and progress meeting.
7.2 Open issues with plan for resolution:
None.
7.3 Issues resolved:
Now that we have a 1-year no cost extension,
we will be able to complete work on the OC48 monitor before this award expires.
We experienced multiple delays with obtaining critical components for construction
of the capture cards, which put us approximately 9 months behind schedule.
All components are now available, and we are on track with a completion date
of July 2001 for the OC48mon.
8.0 Near-term Plan
The material below reflects the activities
planned during Year 3, Quarter 2 of this project, October 1, 2000-December
31, 2000. It is organized according to the categories identified in the Project
Program Plan (see https://www.caida.org/NGI/progplan98.html).
A.
General/Administrative Outreach and Reporting
The following Administrative Outreach and
Reporting items are planned for Year 3, Quarter 2
-Submit Quarterly Report to SPAWAR covering
progress, status and management
-Submit Quarterly Financial Status Report
(UCSD Extramural Funds Dept. submits)
-Submit Quarterly Report of Federal Cash
Transactions (UCSD Extramural Funds Dept. submits)
-kc claffy will attend NANOG 20 in Washington
DC, October 22-24, 2000, see http://www.nanog.org/mtg-0010/index.html.
-kc claffy, David Moore and Ken Keys will
travel to San Francisco on October 30, 2000 to meet with Narus employees to
discuss CoralReef interoperability with commercial tools.
-kc claffy will attend IETF 49 in San Diego,
CA, December 10-15, see http://www.ietf.org/meetings/IETF-49.html.
-kc claffy will visit various Network Modeling
and Simulation researchers including ACIRI, ISI, CalTech, and Berkley to discuss
formats types for data needed by the NMS community.
B. Task 1. Coral OC48mon and GigEther Monitor
The following work is planned for Task 1
during Year 3, Quarter 2:
- Complete initial testing of the DAG 4.1
ATM/POS capture card in New Zealand
- The University of Waikato DAG development
team, Ian Graham, David Miller, and Joerg Micheel, will come to San Diego
in Early November, 2000 to do additional OC48mon testing at SDSC with CAIDA
personnel
- Deploy first OC48 Monitor at location selected
by DARPA P.M.
- Continue to refine the CoralReef requisite
software suite, including the CoralReef
Report Generator tool, and continue optimizing
interoperability with Netramet software
- Continue discussions of OC48mon development
and use with the community
- Develop and deploy a GigEther Monitor at
the SD-NAP.
F. Option 1/DNS Root Server/Visualization of Massive
Datasets/Tomography/Analysis
-Deploy additional skitter hosts at DNS root
server locations
- Continue to collect and analyze data collected
from skitter sources deployed in the field
- Continue to make skitter topology and performance
data available to researchers via Certificate Authority for use in their research
- Continue briefings to the Internet community
on purpose and results of Skitter and solicit their inputs
- Redesign structure and interface of skitter
daily summaries to improve quality of interaction
- Prepare and present technical paper on
initial results from analysis of Skitter/tomographic data
- Make improvements on the Walrus viewer,
including adding ability to load a more complete file format, add filtering
and other interactive processing, and add rendering labels and other attributes
for nodes and links
9.0 Completed Travel
The following travel occurred during Year
3, Quarter 1:
Brad Huffaker attended INET 2000 July 15-21,
2000 in Japan and presented his paper entitled "Measurements of the Internet
topology in the Asia-Pacific Region", see https://www.caida.org/publications/papers/asia_paper/.
-kc claffy traveled to Monterey, California,
to attend the ITC Specialist Seminar on IP Traffic September 16-21, 2000 and
gave the keynote speech.
-kc claffy traveled to Albuquerque New Mexico
to attend the DARPA Network Modeling and Simulation Workshop September 27-29,
2000.
Other related travel occurred but was not
charged to this award.
10.0 Equipment Purchases and Description
An HP Kayak XU800 PC with 64-bit 66 MHZ PCI
bus was purchased in anticipation for use in testing the DAG 4.1 capture card
at SDSC.
11.0 Work Focus
Task 1. Coral OC48 Monitors/GigEther
Coral OC48 Monitor
The Waikato development team completed the
design review of the Dag4.1 OC48 measurement board in early July, and placed
orders for the prototype cards. Due to the long lead-time for some components,
the first board was not delivered until August. Once the board was tested
and found to be satisfactory, construction of further boards commenced. We
now have four working prototype Dag4.1 capture cards that will be tested on
an OC48 link at SDSC in early December.
The Dag4.1 has the following characteristics:
-OC48 SMF optical interface.
-ATM and POS traffic capture
-Conditioned clock with GPS time pulse input
for cell/packet timestamping
-1 Mbyte cell/packet FIFO
-Separate FPGA for cell/packet processing,
with 2 Mbytes SSRAM
-64-bit 66 MHz PCI interface, standard PCI
board form factor
-StrongARM 233 MHz processor with 2 Mbytes
SSRAM
-LINUX device driver and applications software.
We believe that this design will meet the
original performance requirements for an OC48 measurement board.
While the prototypes were constructed, development
of firmware and software continued using the Dag4.0 and 4.1p boards that were
already completed. The Dag4.1 boards will be brought to UCSD for testing
in early November in order to characterize the systems on live OC48 networks.
At present, the Waikato developers are using an OC48 router tester loaned
by Sprint.
CoralReef
CoralReef Version 3.3.2 was released this
quarter. Substantial bug fixes and additions were made, including:
* Fixed writing of files larger than 2 GB
(on systems that support it).
* Fixed configuration test for perl version
(for perl 5.6).
* Avoids overflow at 2^31 in perl FlowCounter
when using C++ backend, and thus
in the t2_* applications.
* Fixed reading of pcap files created on
machines with different byte order.
* Fixed inappropriate alteration of Fore
clock time after clock reset.
For additional updates and fixes, see https://www.caida.org/tools/measurement/coralreef/doc/doc/CHANGELOG.
NeTraMet
Significant activity occurred this quarter
in the arena of porting NeTraMet monitoring software to the CoralReef software
suite. We are integrating NeTraMet with other existing tools to leverage
important functionality applicable to both operational and research questions.
We chose NeTraMet because of its standard IETF real-time flow measurement
software implementation, historically geared towards accounting more than
fine grained workload characterization. Once NeTraMet was ported to CoralReef,
we used it to do workload assessment of common protocols, assessment of short
term and long term trends, and stream size analysis. Analysis is described
below.
NeTraMet Workload Assessment of Common/Popular Protocols
using nifty
Nifty is the X-Window Flow Analyzer tool
from the NeTraMet distribution. It is used to download a specified ruleset
to a meter, collect flow data at regular intervals, and display plots. The
ruleset used with nifty determines which flows the meter will count. It also
specifies the symbols used to plot those flows.
The nifty plots found on https://www.caida.org/research/traffic-analysis/netramet/nifty/
demonstrate how the load on the SDSC link varies, and which applications are
high users of the available bandwidth. (In all cases, the top 20 flows are
shown.) .
NeTraMet Measurement of Weekly Data Rates to Determine
Short-Term of Longer-term Trends
We also investigated short-term and longer-term
trends across a week of data on the UCSD campus commodity Internet link
The plots found on https://www.caida.org/research/traffic-analysis/netramet/drate/
used the NeTraMet ruleset found on https://www.caida.org/research/traffic-analysis/netramet/drate/dns-root.srl.
Plots show ToBitrate and FromBitRate distributions for a single flow corresponding
to the total data rate in each direction on the SDSC link. The distributions
use 48 bins with values ranging linearly from 1 to 24 Mbps. Three plots appear
on each weekly graph. They show the three quartiles for each 5-minute interval,
with the lower quartile in green, median in blue and upper quartile in red.
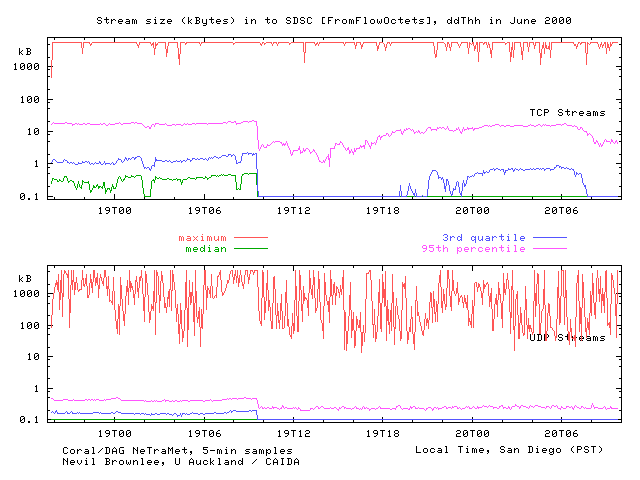
NeTraMet Stream Size and Lifetime Measurements:
Evidence of Sudden Changes and Implications for Routing Context
We analyzed stream sizes as observed on the
UCSD commodity link. We implemented five new distribution-valued attributes
which are not among those in the New Attributes RFC. These attributes are:
FlowTime: Lifetime (in microseconds)
of streams within a flow
ToFlowPDUs: Number of Source ->
Destination packets for streams within a flow
FromFlowPDUs: Number of Destination
-> Source packets for streams within flow
ToFlowOctets: Number of Source ->
Destination bytes for streams within a flow
FromFlowOctets: Number of Destination
-> Source bytes for streams within a flow
Passive monitoring of Internet links can
provide important data on a variety of Internet performance parameters. We
used two publicly available monitoring tools, exploring their synergy and
relevance for collecting and analyzing Internet flow data.. As expected,
total traffic on this link shows the clear effect of student workload trends
as our measurements span the end of a semester and beginning of summer break.
More surprisingly, results from case studies show (1) high loss rates in DNS
flows to root name servers, suggesting that the robustness of DNS is masking
significant congestion based packet loss, and (2) TCP flows, though generally
longer than UDP flows, are still relatively short: over 75 contain fewer than
10 packets and fewer than 2K bytes. Our measurement methodology demonstrates
significant potential for investigating both operational and research questions
of compelling interest to the Internet community.
DNS Root Server/
Visualization of Massive Datasets/Tomography/Analysis
DNS Root Server Initiative
We deployed three DNS root servers during
the past quarter. We sent the "k" skitter monitor to London in early
July, and we collected a destination list. The "a" skitter monitor
was sent to Mark Kosters in July. We also co-located a skitter host with
the "M" root server in Japan in August.
CAIDA did significant work on the DNS prefix
list this quarter. The DNS prefix list, created September 2000, has 58,312
destinations. The goal of this list is to merge the destinations seen at the
DNS servers and select a single IP in each network prefix. Currently, we
have IP lists taken from packet traces at A, J, K, and L. All of these lists,
except for L, have the number of requests made by each IP source address.
We used a BGP table from David Meyer's University of Oregon Route Views project
taken Aug. 8th 2000 to select prefixes. This table contained a total of 87,408
prefixes. The combined list contained a total of 854,084 IP addresses. We
were able to cover 46,844 prefixes by using the IP addresses in this list.
In an attempt to cover the remaining 40,564 prefixes, we augmented the original
list with our own prefix list. We were able to incorporate an additional
9,463 prefixes which resulted in the DNS list containing a total of 56,307
IP addresses. (64.4% prefix covered)
On Wednesday, September 13, 2000, we updated
the original list. The update included the removal of several IP addresses
at the request of their owners and replacement of these IP address with new
ones in the same prefix. We also added a list of possible IP addresses with
two traces from f-root, which contained 1.2M IP addresses. The resulting list
contained 58,312 IP addresses.
Visualization of Massive Datasets
As mentioned in section 5.0., we completed
significant work on the Walrus hyperbolic viewer. Additional improvements
to the tool include:
-Rendering at a guaranteed framerate regardless
of graph size
-Enhancing the 3D-ness with depth cueing
-Navigating with rotations and (hyperbolic)
translations
-Picking nodes (for navigation purposes currently)
- Loading graphs from files (in the basic
interim file format)
-Coloring nodes and links
-Hiding non-tree links
-Displaying non-tree links with transparency
-Other misc. features (three node sizes,
nodes rendered with circles in the correct apparent size, motorized rotations,
wobbling, etc.)
Analysis
CAIDA did comprehensive analysis on several
different facets of skitter and coral data, including definition of the most
well connected part of the Internet, composition of the /24 address space,
skitter destination list composition, and a feasibility study for identifying
poorly served Root Server destinations. We also conducted analysis on packet
fragmentation found at the NASA Ames Internet exchange. We describe the research
in detail below.
Most Well Connected Part of the Internet
We explored various ways to define the most
well-connected part of the Internet. The set of nodes we consider most relevant
to this question are those that can reach the larger part of the Internet
`core', and can do so in the minimum number of hops. In more technical terms,
we try to find `centers' of the giant connected component within the core
of Internet graph topology we have measured.
1. Background from graph theory
Definitions:
a) The combinatorial core of a directed graph
is its subset obtained by iteratively stripping nodes that have outdegree
0 and of 2-loops involving nodes that have no other outgoing edges except
those connecting them to each other. Note that the indegree of either type
of stripped node may be arbitrarily large.
In examples we discuss below, the core contains
between 7% and 12% of the nodes of the original non-stripped graph. In typical
skitter snapshots we have studied, the combinatorial core contains approximately
10% of all encountered nodes.
The iterative stripping procedure may be
selectively applied only to nodes that have both outdegree 0 and indegree
1. This approach strips the `stubs', i.e., trees connected to the rest of
the graph by a single link. We call this superset of the core the extended
core. In our skitter measured topology snapshots, the extended core typically
contains 2/3 of the nodes of the original graph, a much greater fraction than
in the positive outdegree part (our combinatorial core).
b) We call a node B reachable from a node
A if there is a directed path from A to B, i.e. a path in which each directed
edge is taken toward B in the proper direction.
c) A strongly connected component of a graph
is a set of nodes such that each node pair (A,B) has a path from A to B and
a path from B to A.
If A is reachable from B and B is reachable
from A, then any node reachable from A is reachable from B and vice-versa.
Conversely, if the set of nodes reachable
from A is the same as the set of nodes reachable from B, then A is reachable
from B and B is reachable from A, since we always assume that A is reachable
from A. This property means that a connected component is uniquely defined
by the set of nodes that are reachable from nodes of this component. Note
that different connected components will reach different, although not necessarily
disjoint, sets of nodes.
d) We call a connected component a giant
component if it contains more than 50% of the nodes in the graph.
In the cases of skitter data described below,
the giant component and the combinatorial core are very close to each other
- in all our examples the giant component contains over 85% of the core. Furthermore,
almost all of the core is reachable from the giant component, typically near
99%.
There is an interesting dichotomy in the
data: the fraction of the core reachable from any other core vertex is either
more than that reachable by the giant component, or less than 0.5% of the
core. This means that the non-giant component part of the core (the remaining
15% of the core nodes not in the giant component) represents a processing
artifact: our simplistic algorithm does not remove these nodes (that seem
to cluster in small components) yet they definitely do not belong in the core.
Shortest paths on Internet topology graphs
suffer from potential non-conformance with routing policies. We consider them
shortcuts or lower bounds for paths actually taken by
packets. Although shortest-path physical
connectivity is there, policy prevents its use.
In examples we observed, Internet paths actually
traversed by packets were on the average twice as long as the shortest paths
between nodes in the core. (Note that skitter does not collect reverse path
information, but you can use TTLs [Broido 00c] to estimate reverse path hop
count. For destinations in our topology set, the average path length was 17.45
hops (for destinations using an initial TTL setting of 255) or 17.68 hops
(for an initial TTL 128) away, with standard deviations(s) of 4.39 and 3.84
hops, respectively.)
To avoid the pitfalls of shortest path computations
in the models of Internet connectivity, we tried a simple strategy that takes
a sub-graph of a dual graph ("link graph"). In this sub-graph, nodes
are the edges of the original graph, which are connected whenever they form
a path (i.e. one is inbound on a node, and another is outbound at the same
node) and whenever this path was actually observed in data. The advantage
of this technique is that the policy is followed to certain extent. The distinction
between two types of graphs is comparable with a distinction between continuous
and differentiable curves.
Composition of the /24 Address Space skitter Destination
List Composition.
The following text describes the consideration
for developing the /24 address space for the skitter DNS destination list.
Our intent is to build up an industry standard destination list. Measurements
of travel time, jitter, packet loss, path flipping and load balancing, to
mention a few, produced with this list are expected to be bullet-proof, so
that the results would be accepted without any reservations by scientific
community, networking professionals and general public.
To that end we suggest, as a goal, finding
a responding host in each /24 (class C, 256 addr.) block of IP address space.
From this list, any smaller list of destinations tailored for specific purposes
may be extracted when necessary.
Up to this point, skitter operated exclusively
on the basis of ICMP echo requests. However, there is an ongoing concern that
ICMP performance may not reflect the performance of typical traffic. It is
therefore highly desirable to find hosts that respond to queries carried by
UDP and TCP, in addition to ICMP packets. As more and more networks start
filtering ICMP traffic, chances are on the rise that routers may be starting
to treat ICMP on an unequal basis. This problem was not addressed in the study
described below. We plan to approach it in a set of experiments that will
be run in future.
Finding addresses and domain names.
There are over 16 million potential /24s
segments in IP address space. BGP tables from Univ. Oregon RouteViews [RV97]
for July 10, 2000 reflect routable address space that contains 4,172,759
(4.17 million) distinct /24s. (The number was 4,295,498 on May 30, 2000,
a 3% decrease in 40 days.) In the same time interval, the number of prefixes
in all Oregon BGP tables increased from 85481
to 86555, i.e. by 1.33%. We therefore assume that allocated IP space of mid-2000
contains about 4 million /24 segments.
However, to obtain 4 million responding IP
addresses is not realistic, since huge tracts of allocated space may not yet
be actually inhabited by an IP-capable device. Nonetheless,
this number is the best yardstick we have,
and we use it to calibrate the performance of our experiments.
We consulted a number of sources of IP addresses
and host/domain names
to gather IP addresses:
(1) We submitted a list of 30,672 English
words from popular science papers to search engines Excite, AltaVista, HotBot.
Of these, Excite ran the whole list and AltaVista and HotBot got through half
of it. We obtained a few million unique domain names in the process.
(2) We submitted a list of 129,164 geographic
names located outside of the United States
to search engines Excite, AltaVista, HotBot,
LookSmart and AllWeb. Our goal was to counterbalance the bias toward US destinations
that otherwise may be present in replies to English words. We obtained a
few million more unique domain names is in the low millions. It should be
kept in mind, however, that one IP can serve many domain names.
(3) We used a week's worth of Duane Wesssels'
IRCache (Squid) logs
(ftp://ircache.nlanr.net/Traces/) logs from
June 7-24,2000, for another 586,784 distinct host names.
(4) We used IP addresses seen in a packet
header trace seen on UCSD's commodity Internet (CERFnet) link using a Coral
OC3 monitor: a few million IP addresses.
(5) We used IP addresses from CAIDA's NetGeo
database (http://netgeo.caida.org): 1.3 million addresses.
(6) We used skitter traces for 1999-2000,
Cheswick traceroutesand independent traceroutes to Cheswick's IP addresses
from CAIDA's LAN: 357,000 addresses.
(7) CAIDA's web access logs for 1998 - May
2000: over 1 million IP addresses.
(8) Math.ucsd.edu's web access logs for 1998
- May 2000: 300,000 addresses
(9) Mercator [GOV99]] 2 week run from CAIDA's
network: 56K addresses.
It is clear from the list that only few of
these sources produce IP addresses directly. Most publicly available sources
(search engines, caches, http servers access logs) contain domain names and
only a small percentage of raw IP addresses. Their useful output (IPs with
high diversity) is therefore different from the number of hostnames contained.
CERFnet link data is also of limited use
in gathering raw IP addresses, mostly due to UCSD's hosting a packet radio
service for which an entire class A address segment (44.0.0.0/8) is allocated,
a total of 16M addresses. Many of those are assigned on a temporary (per session)
basis. For example, the data from CERF link for the three
weekend days between 23-25 June 2000 contained
1.47 million IPs. Of those, 1.17 million were not found in sources processed
before June 23. Nonetheless, only 162,669 (17%) of them begin with a number
other than 44. Of the remaining IPs, 32494 (20%) are on three prefixes that
belong to UCSD. Low diversity in this data set can be partly blamed on the
weekend timing and on school not being in session in late June.
Poorly served DNS destinations
A feasibility study was conducted for identifying
destinations that are poorly served by the DNS root servers. RTT distributions
were examined in order to quantify the definition of "poor service".
Then we studied the correlation of RTTs for destinations in the same country
in order to verify the predictive power of this metric. We found no intra-day
correlation. Finally, we wrote software and tested for analysis of the skitter
data obtained from DNS root servers.
Packet Fragmentation as seen from a Coral Monitor at
AIX.
The number of fragments in a fragment series
is dependent on both the size of the original packet and the MTU of the link
following the point at which the original packet was fragmented. A high number
of two and three fragment series is expected for packets whose MTU is a bit
too large for the following link. The graphs found at https://www.caida.org/research/traffic-analysis/fragments/fragments_per_series.xml
show only fragments from complete series -- fragment series in which we saw
all of the fragments that made up the original packet. There are several reasons
a series would have missing fragments, including some fragments taking different
paths to the destination and consequently not traveling along the UCSD-CERF
link, and fragments being dropped somewhere along the path between the source
and our monitor box. The link we monitor at the Ames Internet Exchange is
load-balanced -- our monitor captures only a fraction of the traffic through
AIX. Since individual packets can be routed through any of the links at AIX,
and not necessarily the link our monitor can "see", we see far fewer
complete fragment series. 93.0 percent of the fragments monitored on the UCSD-CERF
link are members of a complete series, compared to between 9.6 and 10.8 percent
of the fragments at AIX.
11.2 Significant Events
The director of DARPA, Frank Fernandez, and
CAIDA's DARPA program manager, Mari Maeda, came to SDSC for a site visit/CAIDA
update on Wednesday, August 22. kc, David, and other CAIDA staff discussed
current initiatives concerning Internet monitoring, research and visualizations,
as well as DARPA interests in future simulation, research and analysis.
Brad Huffaker presented a paper entitled
"Measurement of the Internet Topology of the Asia-Pacific Region"
to the INET 2000 conference in Japan.
kc claffy and David Moore attended the Network
Modeling and Simulation Kickoff
Meeting in Marina Del Ray on July 20, 200
to present NGI project results to that group, and find out what else they
needed to make the data useful to that program. The presentation may be found
at https://www.caida.org/publications/presentations/nmsdata/mgp00001.html.
Publications:
Publications: A Nature article showcasing
CAIDA's AS core visualization was sited in Nature Magazine, on the Discovery
Channel, and on MSNBC, see https://www.caida.org/research/topology/as_core_network
FINANCIAL INFORMATION:
Contract #: N66001-98-2-8922
Contract Period of Performance: 16Jul1998
to 15Jul2001
Ceiling Value: $6,655,449
Current Obligated Funds: $2,971,812
Reporting Period: 1Jul2000 - 30Sep2000
Actual Costs Incurred:
Current Period:
UCSD
Labor Hours 3144
Cost $ 101,046.00
ODC's
Cost $ 42,183.00
(includes Waikato Subcontract Cost $ 35,384)
IDC's
Cost $ 54,270
TOTAL:
Cost
$ 197,499
Cumulative to date:
UCSD
Labor
Hours 24,422 Cost $ 827,220.00
ODC's
Cost $ 558,788.00
IDC's
Cost $ 477,033.00
TOTAL:
Cost
$ 1,863,041
Note: additional financial information in tabular form,
including breakdown by subcontract and estimated expenditures for Quarter
8, is attached to this report.
![[CAIDA - Center for Applied Internet Data Analysis logo]](/images/caida_globe_faded.png "Go to CAIDA home page")