|
SPAWARSYSCEN - SAN DIEGO e-mail address: nms@spawar.navy.mil Technical Representatives {nik,rafael}@spawar.navy.mil Maureen Battern Contracting Officer SPAWARSYSCEN SAN DIEGO CONTRACTS D212 PHONE 619-553-4489 FAX 619-553-7822 battern@spawar.navy.mil |
|
University of California, San Diego (UCSD) 9500 Gilman Drive La Jolla, CA 92093-0505 Dr. Kimberly Claffy PHONE 858-534-8333 FAX 858-822-0861 kc@caida.org Contract/Financial Contact Pamela J. Alexander PHONE 858-534-0240 FAX 858-534-0280 pjalexander@ucsd.edu |
Quarterly Status Report #Qtr3
Macroscopic Internet Data Collection and Analysis in Supportof the NMS Community
1.0 Purpose of Report
This status report is the quarterly cooperative agreement report that summarizes the effort expended by the UCSD's Cooperative Association for Internet Data Analysis (CAIDA) program in support of SPAWARSYSCEN-SAN DIEGO and DARPA on Agreement N66001-01-1-8909 during Jan - Mar 2002.
2.0 Project Members
| UCSD hours: | |
| PI: | 129.00 |
| CAIDA Senior Staff: | 1,255.60 |
| CAIDA Staff: | 3,878.20 |
| Total Hours: | 5,262.80 |
3.0 Project Description
This UCSD/CAIDA project focuses on advancing the capacity to monitor, depict, and predict traffic behavior on current and advanced networks, through developing and deploying tools to better engineer and operate networks and to identify traffic anomalies in real time. CAIDA will concentrate efforts in the development of tools to automate the discovery and visualization of Internet topology and peering relationships, monitor and analyze Internet traffic behavior on high speed links, detect and control resource use (security), and provide for storage and analysis of data collected in aforementioned efforts.
4.0 Performance Against Plan
(Please note: Changes since the last reporting period are in boldface
type, and links have been updated with new content.)
| Status | Task 1 Year 1 Milestones: | Notes |
|---|---|---|
| Progress | Add 5 additional skitter source sites | New probe list represents largest representative sample of IPv4 space being monitored in the world. |
| Ongoing | Add 5 passive workload / performance monitor sites | Added web page for accessing NeTraMet measurements |
| Complete | Develop comprehensive website(s) for public availability of data |
| Status | Task 2 Year 1 Milestones: | Notes |
|---|---|---|
| Begun | Establish archive and interactive database for community access to skitter, mantra, routing, and CoralReef data. |
|
| Ongoing | Solicit community feedback regarding needed data types, formats, and dataset sizes. | Discussions occurred at NANOG24 and IETF53, as well as meetings and conference calls with Cisco, Agilent, and Lucent |
| Ongoing | Work with the NMS community to design common experiments | Ken Keys helped NMS/SPAWAR folks to use crl_filter to capture packets and use the libcoral API to analyze packet interarrival times, as part of Nikhil's integration project. |
5.0 Major Accomplishments and Results to Date
Task 1. Monitoring Task
A. Topology Measurement Using Active Probes
Approach
skitter is a CAIDA tool that measures both the forward path and round trip time (RTT) to a set of destination hosts by sending probe packets through the network. It does not require any configuration or cooperation from the remote sites on its target list. In order to reveal global IP topology, CAIDA's Macroscopic Topology Measurement and Mapping project builds software and infrastructure to:
- Collect path and RTT data
- Acquire infrastructure-wide global connectivity information
- Analyze the visibility and frequency of IP routing changes
- Visualize network-wide IP connectivity
An essential design goal of skitter is to execute its pervasive measurement while placing minimal load on the infrastructure and upon final destination hosts. To achieve this goal, skitter packets are small (52 bytes in length), and we restrict the frequency of probing to 1 packet every 2 minutes per destination and 300 packets per second to all destinations. To improve the accuracy of its round trip time calculations, CAIDA added a kernel module to the FreeBSD operating system platform used by its skitter monitors. Kernel timestamping does not solve the synchronization issue required for one-way measurements, but reduces variance caused by multitasking processing when taking round trip measurements. This feature helps to capture performance variations across the infrastructure more effectively. By comparing data from various sources, we can identify points of congestion and performance degradation or areas for potential improvements in the infrastructure.
skitter Monitor Status as of 31-Mar-02 (20 monitors active):
(Changes since the last reporting period are in boldface type.)
| Status | skitter monitor name/location (org) |
|---|---|
| Running | DNS Clients list |
| Active | a-root.skitter.caida.org Herndon, VA, US (Verisign) |
| HW ordered | b-root.skitter.caida.org Marina del Rey, CA, US (ISI) |
| Configuring SW | cdg-rssac.skitter.caida.org Paris, FR (GIP Renater) |
| Active | d-root.skitter.caida.org College Park, MD, US (Univ. of Maryland) |
| Active | e-root.skitter.caida.org Moffett Field, CA, US (NASA) |
| Active | f-root.skitter.caida.org Palo Alto, CA, US (VIX) |
| HW shipped | g-root.skitter.caida.org Vienna, VA, US (NIC.mil) |
| Active | h-root.skitter.caida.org Aberdeen, MD, US (US Army Research Lab) |
| Active | i-root.skitter.caida.org Stockholm, Sweden (Autonomica) |
| Active | k-peer.skitter.caida.org Amsterdam, North Holland, NL (RIPE) |
| Active | k-root.skitter.caida.org London, UK (RIPE) |
| HW on order | l-root.skitter.caida.org Marina del Rey, CA, US (ISI) |
| Active | m-root.skitter.caida.org Tokyo, Kanto, JP (WIDE) |
| Active | sjc.skitter.caida.org San Jose, CA, US (MFN) |
| Active | yto.skitter.caida.org Ottawa, CA (CANet) |
| Running | IPv4Addr BGP Prefix list (133k) |
| Active | champagne.caida.org Urbana, IL, US (VBNS) |
| Running | IPv4Addr BGP Prefix list (330k) |
| Active | lhr.skitter.caida.org London, UK (MFN) |
| Active | nrt.skitter.caida.org Tokyo, Kanto, JP (ABOVE.NET) |
| Active | riesling.caida.org San Diego, CA, US (CAIDA) |
| Active | waikato.skitter.caida.org Hamilton, NZ (Univ. of Waikato) |
| Running | IPv4Addr BGP Prefix list (825k) |
| Active | mw.skitter.caida.org San Jose, CA (Worldcom) |
| Active | skitter.uoregon.edu Eugene, OR, US (Univ. of Oregon) |
| Configuring SW | ams-skt-01.carrier.net Amsterdam, North Holland (Carrier 1) |
| Configuring SW | ams-vu.skitter.caida.org Amsterdam, North Holland (Vrije Univ.) |
| Configuring SW | fra-skt-01.carrier1.net Frankfurt. DE (Carrier 1) |
| Configuring SW | lon-skt-01.carrier1.net London, UK (Carrier 1) |
| HW on order | nlm.skitter.caida.org Bethesda, MD, US (National Library of Medicine) |
| Running | Small list |
| none | none |
| Running | Web Servers list |
| Active | apan-jp.skitter.caida.org Tokyo, Kanto, JP (APAN) |
| Active | iad.skitter.caida.org Washington, DC, US (MFN) |
| Broken | skitter.kaist.kr.apan.net Taejon, KR (APAN) |
| Not running | any list |
| Deactivated | chenin.caida.org Boulder, CO, US (NCAR) |
| Deactivated | galahad.caida.org Ann Arbor, MI, US (CAIDA) |
| Deactivated | nyc-engr-01.inet.ipwest.net New York, NY, US (Qwest) |
| Deactivated | sin.skitter.caida.org Singapore, SG |
| Deactivated | sjo-engr-01.inet.qwest.net San Jose, CA, US (Qwest) |
Topology Analysis Results:
BGP Geopolitical Analysis
The worldwide distribution of Internet resources and address space is highly non- uniform. We present an analysis comparing five demographic measures against three measures of Internet resources, stratified by continent with substratification by country. We found that two continents and one country consume a much larger share of Internet resource allocation than predicted by their demographic measures of size.
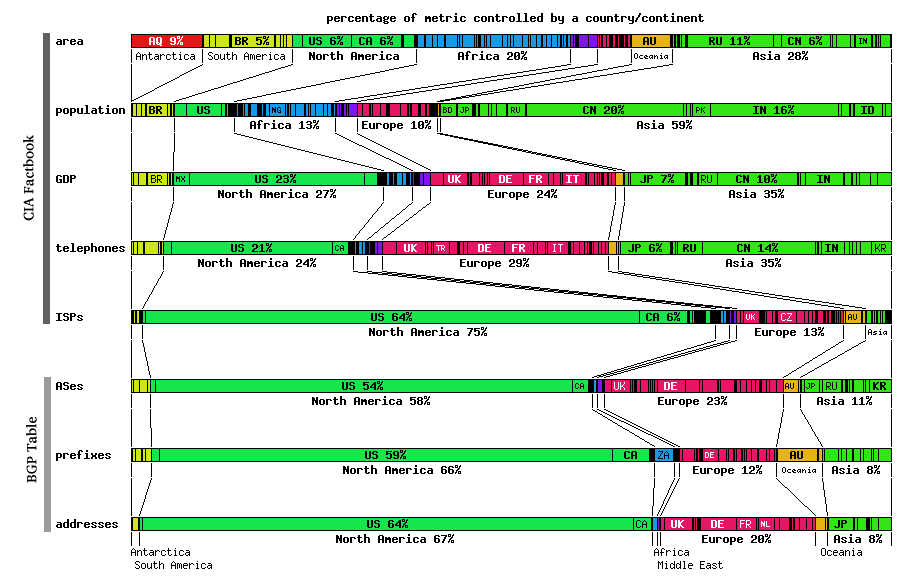
Figure 1. BGP Geopolitical Analysis
This comparison of demographic parameters to Internet resources required multiple data sources. We gathered demographic data - country area, population, GDP, number of telephone lines, number of Internet Service Providers (ISPs) - from a publically available source, the Central Intelligence Agency's (CIA) World Factbook [Factbook] . We derived the Internet resource data - number of Autonomous Systems (ASes), address prefixes, announced address space - from routing tables acquired from major Internet backbones. The Border Gateway Protocol [BGP] routing tables are provided by the University of Oregon's Route Views project [RouteViews] . We performed the geopolitical mapping of the Internet data using our NetGeo [NetGeo] tool. In order to map Internet addresses to physical locations, we made the assumption that prefixes and addresses reside in or belong to the same country as the AS at the end of the AS path. The paths are taken from the BGP tables of June 11, 2001.
Connectivity Ranking of ASes (using large topology sample) as viewed by CAIDA's Macroscopic Topology Measuring/Mapping Project
Using BGP tables and active IP topology probes CAIDA provides a ranking of relative importance for Autonomous Systems (AS) seen based on our topology sample between 13-Feb-02 and 3-Mar-02. This analysis on the connectivity ranking of AS is based on strategic skitter probing against a comprehensive, representative list of IPv4 addresses of unparalleled magnitude. Using this probe list combined with RouteViews snapshots, CAIDA's macroscopic topology monitoring project is able to analyze characteristics of the global Internet that smaller research projects cannot discern.
We rank Autonomous Systems (ASes) by their outdegree in the global AS graph derived from CAIDA's macroscopic topology monitoring project. This value reflects the number of BGP peerings observed between given ASes. We abstract the observed IP links into an AS graph (which has coarser granularity) using the largest set of global BGP tables that are publically available today: RouteViews. We also calibrate our analysis against the AS graph derived from these global BGP tables themselves. Note that in both cases we capture only a subset of the actual number of BGP peering sessions, since we can only observe the `best path' taken at the time our probe executed.
Although CAIDA's global IP topology monitors are spread across the globe, only some (20-25) are active at any one time. We used only seventeen of these monitors for this analysis, and wanted to verify that our results were not biased due to the monitor source(s), i.e., that ASes topologically closer to the monitor source were not disproportionately sampled. To investigate this bias, we repeated the analysis by removing data from one source monitor at a time, and took the minimum rank seen from all such iterations. We also proved that this technique uses a legitimate sample, because results remain consistent even with removal of single peers.
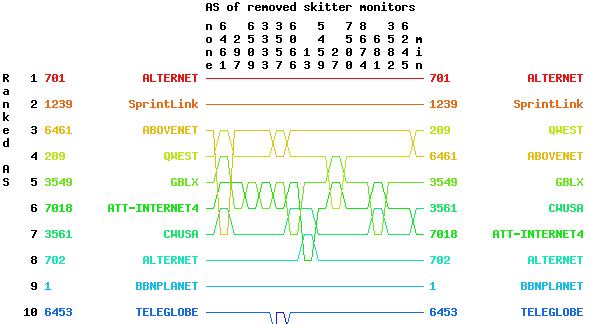
Figure 2. Beginning of AS out degree rank using all links seen by between 2002/02/13 - 2002/03/03.
(Click on image to see all ranked ASes.)
Shown on the left side of Figure 2 are the AS number and name ranked on the total graph, i.e., where no source monitors were omitted from the analysis. The y-axis labels on the right side show the AS ranking that results from using the minimum ranking just described. The AS numbers at the top (under `removed AS') represent the AS of the topology monitor source that we removed; the corresponding AS ranking appears below that column in the plot. Note that this AS connectivity ranking changes slightly when we remove certain monitors from the analysis, e.g., when we remove the monitor in AS27 or AS297, AS209's ranking drops from 2nd to 3rd place. Note that several ASes may share the same minimum ranking, but may not share the same second lowest ranking, so the aglorithm is somewhat more complicated than a simple min(ranking).
This AS connectivity ranking was explicitly requested by Cisco Systems in order to identify critical infrastructure. Results are relevant to maintaining homeland security.
New 3D Graph Visualization Tool (walrus)
This quarter, CAIDA published two sets of walrus 3D visualizations based on real Internet measurement data:
Walrus Visualization of Round-Trip Time Internet Measurements
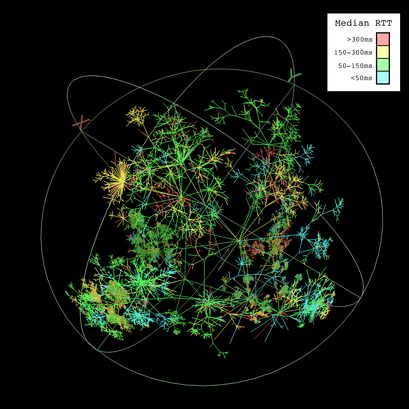
Our visualization shows a single cycle of measurements made by the monitor in Herndon, VA on Feb 2, 2002. From this data, we created a graph showing the topology of the Internet covered by the probes. We then overlaid RTT measurements on the links. Since links, properly speaking, do not have RTTs, and since the monitor collects RTTs to destinations only (and not also to the routers lying along the path), we colored a link by the median of the RTTs seen for all destinations that were reached through the link. Thus the color of a link summarizes the performance characteristics of all destinations that fan out from the link. Clusters of one color indicate clusters of destinations with similar latency values from this source monitor. This coloring also allows one to see the intermediate nodes at which performance begins to diverge.
Figure 3. Walrus Visualization of RTT
Note: CAIDA provided this walrus image to NSF for use on the cover of the multi-agency Blue Book. https://www.caida.org/research/performance/rtt/walrus0202/.
Walrus Visualization of CodeRed Worm Infections
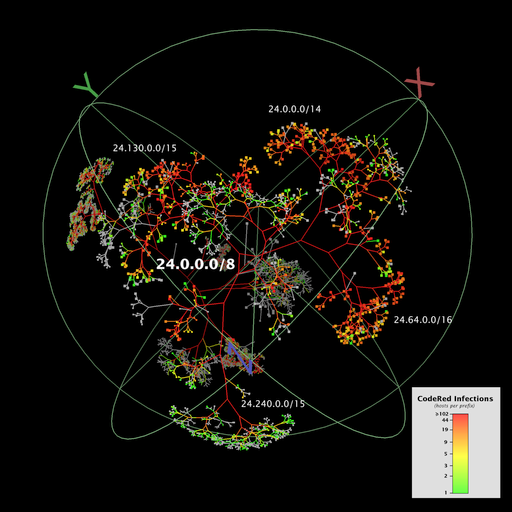
This visualization depicts the number of hosts infected by CodeRed (and variants) during the 24 hour period starting on July 19, 2001, UTC. The counts of infected hosts are aggregated at the granularity of prefixes. Each node represents a BGP prefix announced to RouteViews on July 19th. Prefixes without any infected hosts are colored grey, while prefixes with infected hosts are colored green to red on an approximately logarithmic scale according to the number of infections. Interior nodes have a count equal to the cumulative sum of their children, and links have the color of the node at the end lower down in the tree. The prefixes themselves are arranged in a binary tree representation of the 32-bit IP address space covered by the announced prefixes.
Figure 4. Walrus Visualization of CodeRed Infections
Although this Walrus screen capture shows the entire set of announced prefixes, detail is only visible in the nearest branch of the tree, which is centered on the node representing the prefix 24.0.0.0/8. The image naturally divides into two overlapping planes that are parallel to the screen of the viewer. The background plane contains relatively dark clusters of nodes that reveal little detail. The foreground plane contains the subtree that represents 24.0.0.0/8 and all its longer prefixes. This subtree is lighter in appearance than the subtrees of the background plane and occupies a large portion of the display area.
The 24.0.0.0/8 subtree prominently shows a large number of infections. This is unsurprising since 24.0.0.0/8 contains prefixes belonging to @Home, RoadRunner, and AT&T broadband services, as well as others, and these ISPs have a large base of residential and small business customers. CAIDA's analysis shows that home users and small businesses were among the most heavily infected as a class.
Alpha version 0.2 of walrus was released on 25 Jan 02. Changes include:
- Added some more introductory documentation on the LibSea file format to help people to get up to speed quickly.
- Added support for overlaid node labels. Attribute values can now be shown in the display area next to the relevant nodes. These labels, however, are only temporary and disappear once the user moves or refreshes the window.
- Added support for selection attributes. A boolean attribute in the graph file can be used to specify which nodes or links are to be displayed.
- Added support for displaying attributes of list type. Previously, only scalar attributes could be displayed.
- Improved the layout of binary trees. Walrus now makes better use of available space when laying out binary trees.
- Fixed bug in which links would sometimes be drawn as black lines. If you had transparency enabled and then switched the coloring of links to RGB (that is, to colors stored in an attribute), then links would sometimes be drawn incorrectly as black lines.
- Fixed bug in which rotations would stop working when axes were disabled while running the nonadaptive render loop.
B. Workload / Performance Measurement Using Passive Monitors
OC48 Traces were successfully captured from the Metromedia Fiber Network (MFN) backbone in San Jose, CA. Data was provided to CAIDA from the WAND Research Group (University of Waikato, New Zealand) using their deployed OC48 DAG interface card. Analysis results (provided below) used CAIDA's CoralReef software suite.
OC48 data was also used by Nevil Brownlee to compare stream sizes on OC3 (Auckland), OC12 (UCSD) and OC48 (MFN) links. This analysis was used in the poster paper "Internet Stream Size Distributions" which was accepted for presentation at the SIGMETRICS conference in June 2002.
NeTraMet Software Development:
CAIDA machine netramet.caida.org is configured to continuously record DNS response times. In order to make these measurements available to the NMS community, a daily cron job generates strip charts from collected measurements. In addition, a new web page form allows researchers to access root and gTLD DNS server performance measurements since January 2002.
Analysis Results: Workload Characterization of an OC48 Link
OC48 Data from MFN, January - March 2002
We have gathered four traces during this period (1/9/02, 1/30/02, 2/1/02, 3/5/02).
Breakdown of Data by Application.
Using port mapping through our CoralReef software suite, we infer application for each incoming packet. We present four tables showing the breakdown of traffic in bytes stratified by application for the top 25 applications.
For each date, similar to the data we analyzed from October, HTTP traffic dominates both directions of the trace. The proportion of traffic varies from approximately 45% to approximately 66% of all traffic for a given direction and day.
Peer-to-peer applications (e.g. EDONKEY, FASTTRACK) comprise a significant portion of the remaining traffic. Graphical versions of this data for bytes, packets, flows, bytes per flow and packets per flow can also be found at the CAIDA website.
Date : 01/09/02
| Direction = 0 Applications | Direction = 0 Percentage Traffic | Direction = 1 Applications | Direction = 1 Percentage Traffic |
| "WWW" | 39.1585398652422 | "WWW" | 53.2297991871413 |
| "FASTTRACK" | 29.1582013605691 | "Unclassified_TCP" | 15.1087676856762 |
| "Unclassified_TCP" | 10.5869588637174 | "EDONKEY_TCP" | 9.59095313565473 |
| "EDONKEY_TCP" | 3.35423079001429 | "FTP_DATA" | 5.16542752775284 |
| "NAPSTER_DATA" | 3.30097240102051 | "FASTTRACK" | 3.8650084384513 |
| "SMTP" | 2.1242369139964 | "NNTP" | 2.67422971331297 |
| "GNUTELLA" | 2.07687214541172 | "Unclassified_UDP" | 2.2701566239652 |
| "Unclassified_UDP" | 1.75299774039548 | "MS_MEDIA" | 1.74821923766606 |
| "No_Ports_UDP" | 1.41214214202599 | "SMTP" | 1.39400828648156 |
| "FTP_DATA" | 0.895093556718037 | "SHOUTCAST" | 1.02318694305408 |
| "REALAUDIO_UDP" | 0.708028184187465 | "No_Ports_UDP" | 0.70102566636142 |
| "DNS" | 0.685576041229732 | "GNUTELLA" | 0.433892998117528 |
| "MS_MEDIA" | 0.617342555674578 | "ESP" | 0.388727742922287 |
| "NNTP" | 0.398641140622051 | "NAPSTER_DATA" | 0.360457850346781 |
| "HTTPS" | 0.375404889009948 | "DNS" | 0.355522038574275 |
| "ASHERONS" | 0.350301368719271 | "HTTPS" | 0.307786437706721 |
| "RTSP" | 0.319883846893444 | "POP" | 0.239780281471985 |
| "ICMP" | 0.28971304210442 | "REALAUDIO_UDP" | 0.237580801206812 |
| "SQUID" | 0.273149356157932 | "HALFLIFE" | 0.114376190940751 |
| "ESP" | 0.246628689143057 | "IRC" | 0.0884075132301714 |
| "HOTLINE" | 0.227506100121992 | "QUAKE" | 0.0746017554215266 |
| "HALFLIFE" | 0.223976237933218 | "NETBIOS" | 0.0662186382994278 |
| "FTP_CONTROL" | 0.185232496750733 | "FTP_CONTROL" | 0.0573381812318795 |
| "QUAKE" | 0.14370151632928 | "SSH" | 0.051177227172389 |
| "GRE" | 0.113526605540367 | "RTSP" | 0.0427374406110035 |
Date : 1/30/2002
| Direction = 0 Applications | Direction = 0 Percentage Traffic | Direction = 1 Applications | Direction = 1 Percentage Traffic |
|---|---|---|---|
| "WWW" | 55.1920725674894 | "WWW" | 44.1276127326881 |
| "Unclassified_TCP" | 15.0034464382232 | "EDONKEY_TCP" | 18.2706368158702 |
| "FASTTRACK" | 11.6694524446177 | "Unclassified_TCP" | 11.6284433985721 |
| "SHOUTCAST" | 2.11421061284364 | "FTP_DATA" | 9.77722934178024 |
| "SMTP" | 1.96056750457127 | "FASTTRACK" | 3.60804231071722 |
| "NAPSTER_DATA" | 1.94434537638563 | "Unclassified_UDP" | 2.40735273380636 |
| "EDONKEY_TCP" | 1.6346951709043 | "MS_MEDIA" | 2.38898311956623 |
| "Unclassified_UDP" | 1.33863753931895 | "No_Ports_UDP" | 1.76872844681068 |
| "ICMP" | 1.27322469951855 | "NNTP" | 1.49038273498827 |
| "GNUTELLA" | 0.907413656684339 | "SMTP" | 1.13413285714501 |
| "No_Ports_UDP" | 0.832023679372833 | "SHOUTCAST" | 0.517937984529793 |
| "MS_MEDIA" | 0.721654094045157 | "REALAUDIO_UDP" | 0.442489081717315 |
| "FTP_DATA" | 0.585931661479907 | "GNUTELLA" | 0.387580051548215 |
| "NNTP" | 0.581370016076686 | "NAPSTER_DATA" | 0.266032606125089 |
| "HALFLIFE" | 0.563476343045746 | "HTTPS" | 0.241563896417262 |
| "HTTPS" | 0.476202500218051 | "RTSP" | 0.212304930627298 |
| "REALAUDIO_UDP" | 0.395028351136957 | "DNS" | 0.186956545104247 |
| "SSH" | 0.363930436377077 | "POP" | 0.15966541731524 |
| "DNS" | 0.346959851113869 | "RSYNC" | 0.12033304999716 |
| "ICMP_ECHO" | 0.26091537176138 | "HALFLIFE" | 0.0879223149707617 |
| "RTSP" | 0.240598752277828 | "GRE" | 0.0810087344421074 |
| "ASHERONS" | 0.217500578310103 | "HOTLINE" | 0.0753230210892145 |
| "SQUID" | 0.208591825494675 | "CHARGEN" | 0.0645834452144977 |
| "X11" | 0.145472707443794 | "MS_NETMEET" | 0.0584030591472758 |
| "POP" | 0.133512719141607 | "IRC" | 0.0476558805678585 |
Date : 2/1/02
| Direction = 0 Applications | Direction = 0 Percentage Traffic | Direction = 1 Applications | Direction = 1 Percentage Traffic |
| "WWW" | 56.4688472418127 | "HTTP" | 46.0220442221497 |
| "FASTTRACK" | 13.2937644727427 | "Unclassified_TCP" | 14.1547195146012 |
| "Unclassified_TCP" | 11.550490211968 | "EDONKEY_TCP" | 12.6920808953163 |
| "NAPSTER_DATA" | 2.8871109422002 | "FASTTRACK" | 5.05273612733297 |
| "EDONKEY_TCP" | 2.73120139487112 | "FTP_DATA" | 4.44822839358391 |
| "Unclassified_UDP" | 1.46507696588752 | "MS_MEDIA" | 3.65233592721712 |
| "GNUTELLA" | 1.39908213716628 | "Unclassified_UDP" | 3.26422819692124 |
| "SHOUTCAST" | 1.16296713478713 | "No_Ports_UDP" | 2.2230301569785 |
| "SMTP" | 1.14425960911092 | "NNTP" | 1.93252954309197 |
| "MS_MEDIA" | 0.792473482324367 | "SMTP" | 1.24732036580942 |
| "No_Ports_UDP" | 0.785635956287424 | "GNUTELLA" | 0.690556022646949 |
| "FTP_DATA" | 0.777098524370183 | "NAPSTER_DATA" | 0.646081991068483 |
| "REALAUDIO_UDP" | 0.66345829431801 | "REALAUDIO_UDP" | 0.54897684876072 |
| "SQUID" | 0.653355664110247 | "DNS" | 0.394247858977283 |
| "DNS" | 0.511352535177083 | "HTTPS" | 0.339199002831816 |
| "HTTPS" | 0.458999831633805 | "RTSP" | 0.334249336052921 |
| "NNTP" | 0.375291101199059 | "ESP" | 0.30973146491161 |
| "ICMP" | 0.345809628102418 | "SSH" | 0.266265145289287 |
| "HOTLINE" | 0.311684624873753 | "POP" | 0.218573915581179 |
| "ASHERONS" | 0.28745868680661 | "SHOUTCAST" | 0.196944306352436 |
| "HALFLIFE" | 0.28444598924432 | "HALFLIFE" | 0.140245036636319 |
| "RTSP" | 0.267133042001036 | "QUAKE" | 0.114616974178444 |
| "GRE" | 0.144850229818758 | "HOTLINE" | 0.101463394528272 |
| "ICMP_TIMXCEED_INTRANS" | 0.123737489517357 | "ICMP" | 0.0950411528222673 |
| "ESP" | 0.109991256811569 | "SQL" | 0.0804770448969932 |
Date : 3/5/2002
| Direction = 0 Applications | Direction = 0 Percentage Traffic | Direction = 1 Applications | Direction = 1 Percentage Traffic |
| "HTTP" | 64.8910821733941 | "HTTP" | 47.9015540594284 |
| "Unclassified_TCP" | 9.87028194859787 | "NNTP" | 13.7594618673374 |
| "FASTTRACK" | 3.52616843508359 | "EDONKEY_TCP" | 12.9285727591777 |
| "Unclassified_UDP" | 2.98115752329109 | "Unclassified_TCP" | 10.0891695449652 |
| "No_Ports_UDP" | 2.741310835798 | "FASTTRACK" | 2.71139309450823 |
| "NNTP" | 2.69623646423906 | "SMTP" | 2.20611789112506 |
| "GNUTELLA" | 2.138985535604 | "GNUTELLA" | 2.13079398459513 |
| "EDONKEY_TCP" | 1.81531642911894 | "FTP_DATA" | 1.67317985627678 |
| "SMTP" | 1.53059825551389 | "Unclassified_UDP" | 1.10793795353345 |
| "MS_MEDIA" | 1.4294263794531 | "MS_MEDIA" | 1.05100716546267 |
| "RTSP" | 1.40670563915776 | "NAPSTER_DATA" | 0.557601987275264 |
| "SQUID" | 0.762468021780421 | "No_Ports_UDP" | 0.353492495528424 |
| "NAPSTER_DATA" | 0.684519461638214 | "HTTPS" | 0.350192136589987 |
| "FTP_DATA" | 0.520651844713952 | "DNS" | 0.342232384768757 |
| "ICMP" | 0.40405058400851 | "ESP" | 0.270674809582849 |
| "HTTPS" | 0.352003877906268 | "RTSP" | 0.251823696441988 |
| "REALAUDIO_UDP" | 0.310393101809046 | "ICMP_ECHOREPLY" | 0.232636170550608 |
| "DNS" | 0.232413269151307 | "REALAUDIO_UDP" | 0.232062241622133 |
| "SHOUTCAST" | 0.199625544499803 | "POP" | 0.213857016597391 |
| "HOTLINE" | 0.180417502375096 | "RSYNC" | 0.209381342002184 |
| "FTP_CONTROL" | 0.158873340452071 | "SHOUTCAST" | 0.15131018295245 |
| "IDENT" | 0.154203259059203 | "FTP_CONTROL" | 0.144501855013 |
| "IRC" | 0.104012872613523 | "IRC" | 0.114740994530617 |
| "AOL" | 0.0960590127232544 | "HOTLINE" | 0.110246342532948 |
| "ESP" | 0.0829758385514937 | "HALFLIFE" | 0.0879879902434034 |
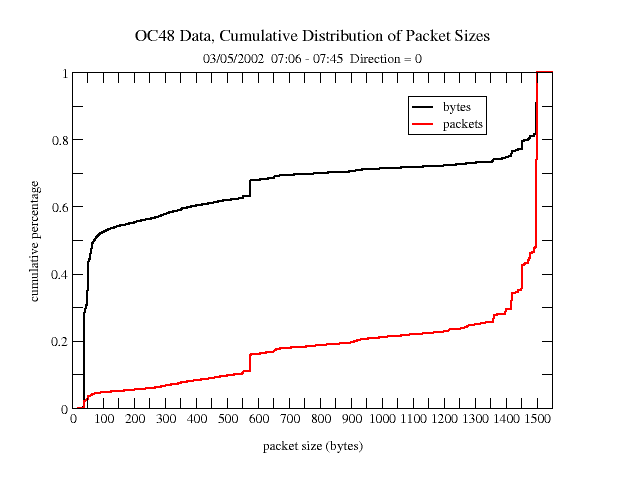
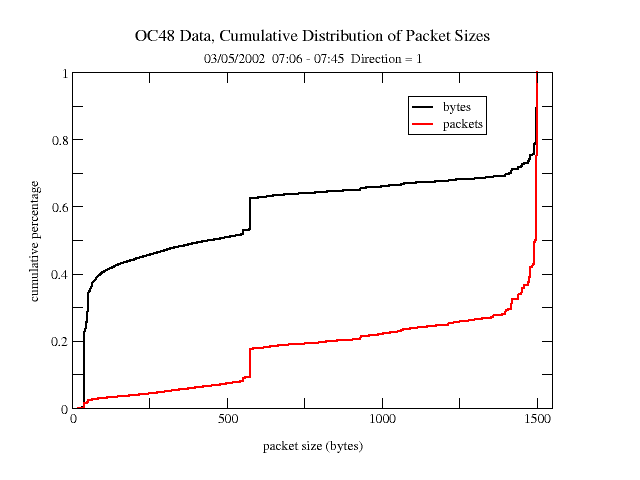
Cumulative Distribution of Packets
 |  |
| Figure 5a. Direction=0 | Figure 5b. Direction=1 |
We present the distribution of packet sizes for the March 5th trace. We note that there is an asymmetry between the two interfaces. This may suggest that one side (with the the smaller packet sizes) may represent more clients, while the other interface (traffic from North America) may represent more servers. Data from all traces looks similar.
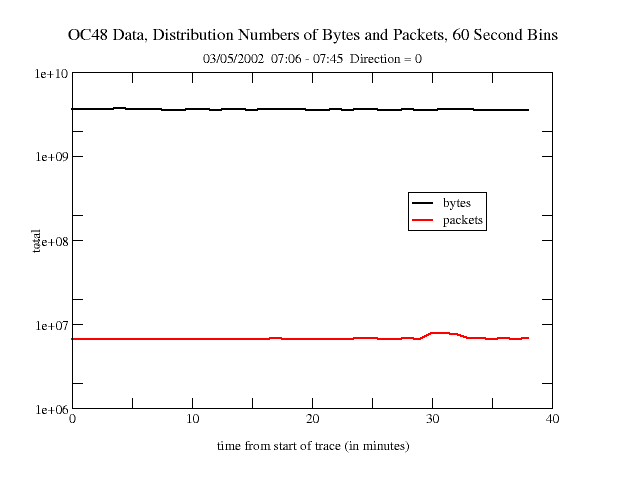
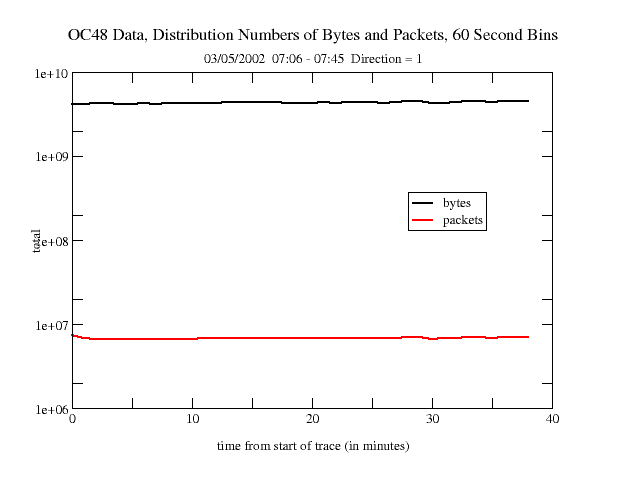
Distribution of Bytes and Packets Over Time
 |  |
| Figure 6a. Direction=0 | Figure 6b. Direction=1 |
We have analyzed the OC48 data to show the amount of traffic over time during any given trace. We present data from March 5, 2002. The data looks similar for both interfaces.
DNS Queries
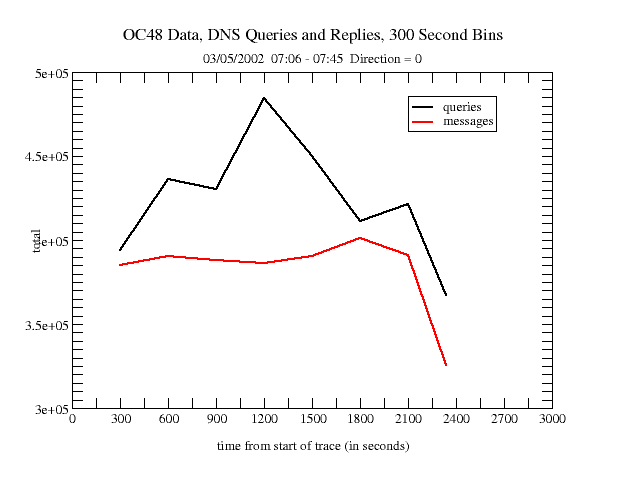 | 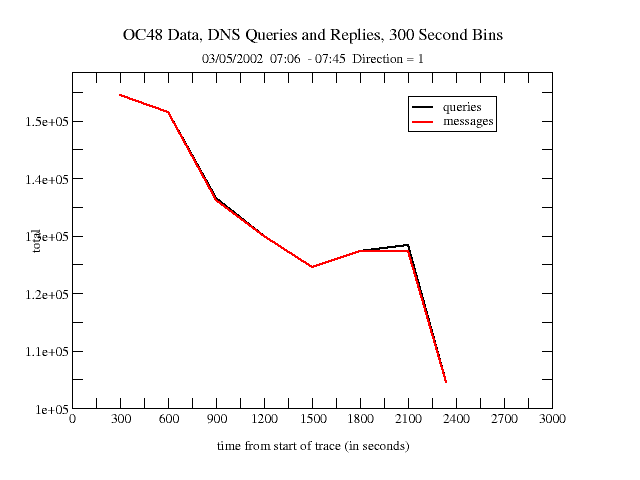 |
| Figure 7a. Direction=0 | Figure 7b. Direction=1 |
We have performed a preliminary analysis of DNS queries and messages in the OC48 trace data. (A single message may contain one or more queries). This data represents 300 second bins. (The precipitous dropoff on the right of each graph is the result of a bin with a value of less than 300 seconds). DNS query/message values can vary widely between both traces and interfaces.
Source / Destination Traffic Analysis
We examined traffic patterns between countries and regions of the world using CAIDA's NetGeo interface to infer locations of IP addresses within countries using RouteViews BGP tables. We assign each packet to a source/destination pair and, using xrt3d, plot the absolute values for traffic from each pair.
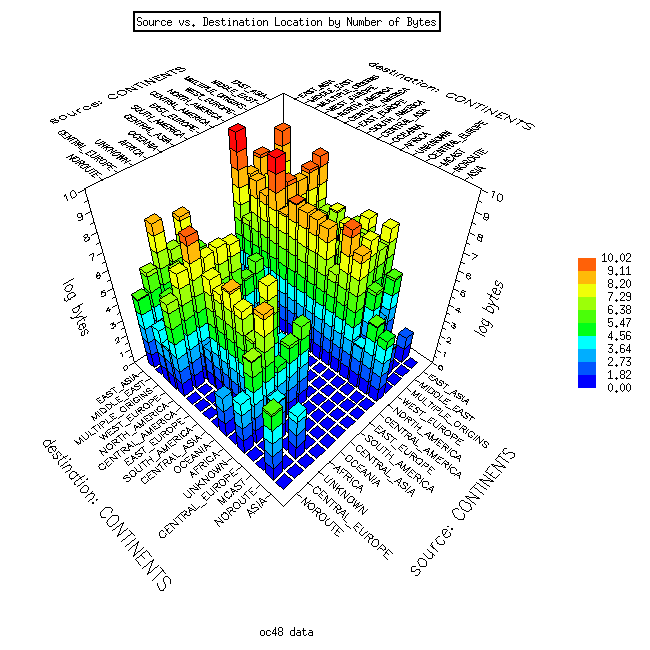 | 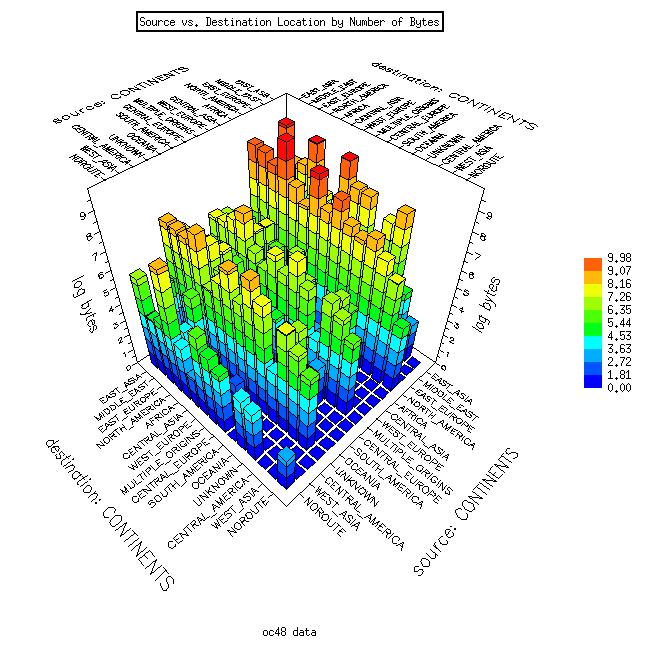 |
| Figure 8a. Direction=0 | Figure 8b. Direction=1 |
There are distinct differences between values for the two interfaces. We have plotted traffic values in bytes between regions of the world. The data from direction 1 shows that North America (in particular the US) is the dominant source for data by orders of magnitude. Direction 0 data reveals a somewhat more balanced mix with a number of regions as sources.
We have also plotted these source/destination matrices using CAIDA's interactive GeoPlot tool. Rather than using a three-dimensional program, GeoPlot represents both source and destination locations as nodes and the traffic between nodes as links. Moving the mouse over the links shows the relative flow of traffic for a given source/destination pair. This provides the user with an interactive demonstration. We have generated GeoPlot analyses for all regions of the world.
Summary pages have been created for the following four collected OC48 traces:
C. Routing Measurement
Andre Broido and k claffy began analysis of multiorigin prefixes, defined as BGP table prefixes having more than one origin. Multiorigin prefixes stand in the way of comparing BGP AS graphs with skitter traceroute AS graphs and other analyses. Why do these prefixes exist? It is quite likely that the majority of multiorigin prefixes in any single snapshot of a BGP table consist of "undecided" origins captured at the moment of convergence, i.e. transition between one origin to another. Details of this study can be found here.
Andre Broido, Evi Nemeth and k claffy published a seminal paper "Internet Expansion, Refinement, and Churn" in the ETT journal. In this paper they analyze the evolution of the global Internet interdomain routing system on AS, prefix and IP address level granularities, using snapshots of RouteViews BGP tables from 1997 to 2001. They introduce the notion of semiglobally routed prefixes, which are those present in the majority of backbone tables, and classify them into standalone -- those which have no subsets, no supersets; root -- have subsets, but no supersets; and subset, or more specific, which are subsets of other blocks.
Using these distinctions they find that from 1999 to 2001 many measures of routing system complexity demonstrated stability in the form of slow growth, dynamic equilibrium, and occasional contraction.
They find that many net change measures reflect contributions of opposite sign, and that true measure of variation, or churn, is the sum of their absolute magnitudes rather than the difference. Appearance and disappearance of prefixes, ASes and RouteViews peers, as well as status changes (an AS changing from transit to non-transit, or a prefix shifting from a standalone prefix to a root prefix) are instances of routing system churn. One advantage of using our notion of semiglobal prefixes is that these prefixes exhibit less churn than global prefixes (those prefixes common to all backbone tables) and as such allow for derivation of more robust macroscopic statistics about the routing system.
They study route prefix instability at a medium time granularity for late 2001 using 2-hour snapshots of BGP tables, and find that half of all prefix reannouncements (flips) are contributed by 1% of all ASes, with government networks, telecoms in developing countries and major backbone ISPs at the top of the list of instability contributors. Small ASes (those who originate only a few prefixes into the global routing system) do not contribute more than their fair share of either route entries or churn to the global routing system. They conclude that during 1999-2001 many Internet metrics were stable, and that the routing system's growth and instability are mostly caused by large and medium-sized ISPs.
Task 2, Archiving and Storage Task
Approach for Archiving skitter Data and Making Data Available to Researchers
| Requestor | Organization | Project |
|---|---|---|
| Omer Ben Shalom | Tel-Aviv University | BGP atoms |
| Sandjai Bhulai | Vrije Universiteit (Amsterdam, NL) | topology research |
| Barry Raveendran Greene | Cisco Systems (San Jose, CA) | security incident notification |
| Ben Musial | AFIT Computer Engineering | network visualization |
| Doris Ressmann | De Montfort University Communication Network Research Group (United Kingdom) | reconfiguration simulation |
| Ben Y Zhao | UC Berkeley (Berkeley, CA) | Tapestry project |
|
Other Current Collaborative Projects | 20 | |
| Previous Collaborative Projects | 1 | |
| PhD Students Using skitter data | tbd | |
| Master's Students Using skitter data | tbd | |
| Publicly Available skitter data | ||
Approach for Archiving CoralReef Data
- CAIDA added a new SDNAP report generator to work with new network environment configuration: https://www.caida.org/dynamic/analysis/workload/sdnap/0_0_/. A "monitor" often includes multiple taps (e.g., one inbound and one outbound); each of these tap interfaces can in turn contain multiple subinterfaces (e.g., VLANs, or ATM VPVCs). In the case of the SDNAP page, there's only one tap interface, with only one subinterface; it's labelled "0[0]". The main SDNAP report now contains a link to the newly repaired "0[0]" page that gives more detail on that subinterface.
- CAIDA provided OC48 data to Jun Xu, a student at Georgia Tech. To send a 12 minute trace took four 300Mb files times two directions, yielding a total of 2.4Gb.
- CAIDA provides a demonstration of CoralReef data collection, analysis, and reporting at: https://www.caida.org/dynamic/analysis/workload/sdnap/. Results are updated every 5 minutes.
- CAIDA archives CoralReef data for special purpose studies as needed, but must limit data collection to available disk space.
- CAIDA is working to upgrade the OC48 monitor at MFN to house bigger Dag4.10 cards. This upgrade requires a dual-Pentium (Intel) processor on tyan S2510; 1Gb of RAM; floppy; CDROM; IDE/ATA disk drive (40Gb min); 6 SCSI Ultra/160 disks (3 mininum 18Gb capacity disks/SCSI channel); 4U rack mountable chassis. Upon deployment, this upgrade will allow collection of 1 hour traces as ~50Gb files. Please note: CAIDA would like to deploy OC48 monitors at other locations, but this will require additional funding.
6.0 Artifacts Developed During the Past Quarter
None7.0 Issues
Although authorization to release our next funding increment was given by our Program Manager, we have not yet received it, so are operating at a significant deficit. As of April 17, 2002 our funds appear to be under the control of San Diego SPAWAR.
8.0 Near-term Plan
The following work is planned for 01-Apr-02 through 30-Jun-02:
General/Administrative Outreach and Reporting Plans
- Submit Quarterly Report to SPAWAR covering progress, status and management.
Task 1. Monitoring Task Plans
- A. Topology Measurement
- B. Workload Measurement
- CAIDA will continue to analyze traces gathered from OC48 links at Metromedia Fiber Network (MFN) in San Jose. We are trying to find other locations for OC48 traffic taps, but need additional funding for that.
- Refinement of the CoralReef software suite will continue, (https://www.caida.org/tools/measurement/coralreef/ ) especially concerning improving the CoralReef Report Generator tool https://www.caida.org/tools/measurement/coralreef/components.xml#HTML as well as optimizing interoperability with NeTraMet. Release of an updated version of CoralReef is expected next quarter (Apr-Jun 2002).
- CAIDA has forged an agreement with Lucent to allow testing of the newest version of their Optistar OC48 cards with CoralReef software.
- C. Routing Measurement
CAIDA will continue to collect and analyze data for its macroscopic topology project.
CAIDA will continue to refine methodology and results from ongoing routing studies. Several projects begun at the IPAM workshop will be documented and reported.
Task 2, Archiving and Storage Task Plans
- We received a large donation of equipment (including a Sun Fire V880!) from Sun Microsystems that allows us to significantly improve our analysis and data storage capabilities. This industry support represents valuable cost-sharing as well as support for network research.
- We will continue to collect and analyze data collected from skitter sources deployed in the field
- We will continue to make skitter topology and performance data available to researchers via password authentication for use in their research and monitor results. See: https://www.caida.org/data/skitter/skitter_data_use.xml
- We will continue briefings to the Internet community on the purpose and results of skitter active monitoring and will solicit their feedback.
- We will refine the collection and archiving of skitter data
- We will make additional improvements on the Walrus viewer. See: https://www.caida.org/tools/visualization/walrus/
9.0 Completed Travel
The following travel incurred expenses to this award and occurred during Year 1, Qtr 3, 1-Jan-02 through 31-Mar-02:
- kc claffy 1/5 - 1/7 NGI PI Meeting McLean, VA
- kc claffy and David Moore 3/5 - 3/6 NRC Internet Post 9/11 Workshop Washington, D.C.
- kc claffy 3/11 - 3/12 IPAM Workshop at UCLA
- Nevil Brownlee 3/17 - 3/22 IETF53 Minneapolis, MN
- Nevil Brownlee 3/25 - 3/26 PAM Workshop Ft. Collins, CO
Other related travel occurred but was not charged to this award.
10.0 Equipment Purchases and Description
No equipment was purchased.
11.0 Significant Events
- CAIDA hosted Anukool Lakhina, a student of Mark Crovella at Boston University from Jan 6-13. Anukool is working on 1) a geographic mapping project, and 2) modifiying skitter to implement intermediate hop RTTs.
- CAIDA researchers were invited to participate and present at the IPAM workshop "Large-Scale Communication Networks: Topology, Routing, Traffic, and Control" held March 18-22 at UCLA
- k claffy was invited to speak on "Macroscopic Internet interdomain routing and topology analysis" at the combined UCSD/UCLA/STANFORD Winter School in Chaotic Communications, 13-16 January 2002. Andre Broido also made several related presentations.
- k claffy and Andre Broido discussed a new template entry for Internet address registration with ARIN in January.
- k claffy discussed OC48 tracefile statistics with Cisco, with respect to identifying requirements for next-generation Cisco products. (Jan 19, 2002)
- k claffy and Ryan Koga attended the WIDE Project Workshop 2002 at Stanford University Jan 25, 2002. http://junsec.wide.ad.jp/ws/2002.
- CAIDA researchers met with Agilent to discuss joint work and NMS technology transfer Jan 31, 2002.
- k claffy, Evi Nemeth and Andre Broido spoke at NANOG24 Mtg Feb 10-12, 2002, in Miami, FL. http://www.nanog.org/mtg-0202/agenda.html.
- k claffy met with SPAWAR and SDSC people to discuss NMS and security technologies, Feb 13, 2002.
- Participated in NMS conference call, Feb 25, 2002, led by Richard Fujimoto.
- Participated in conference calls with Lucent Optistar team (ref Amy Polcari polcari@lucent.com) to get an update on Optistart OC48 network adaptors and determine if these cards will work for OC48 traffic monitors. Feb 2002.
- k claffy and David Moore participated in the NRC Internet post
9/11 terrorist workshop held in Washington, D.C., Mar 5-6, 2002. They presented:
- https://www.caida.org/research/topology/resilience/
- https://www.caida.org/~bhuffake/temp/9.11/
- https://www.caida.org/research/topology/rank_as/
- https://www.caida.org/cgi-bin/dns_perf/main.pl//
- CAIDA provided a walrus image based on real measurement data for use by NSF on the cover of the multi-agency Blue Book. https://www.caida.org/research/performance/rtt/walrus0202/. This image shows
- Nevil Brownlee presented his DNS work at IETF53 in Minneapolis, MN Mar 17-22. He also met with RSSAC and the IPFIX group. http://www3.ietf.org/proceedings/02mar/index.html.
12.0 Publications and Presentations:
- The following papers were published:
- Huffaker, B., Plummer, D., Moore, D. and k claffy, "Topology discovery by active probing", SAINT International Symposium on Applications and the Internet, Nara, Japan, Jan 28 - Feb 1, 2002. https://www.caida.org/publications/papers/2002/SkitterOverview/.
- Broido, A., Nemeth, E., and k claffy. "Internet Expansion, Refinement, and Churn" European Transactions in Telecommunications (ETT) journal. https://www.caida.org/publications/papers/2002/EGR/
- Brownlee, Nevil and Ilze Ziedins, "Response Time Distributions for Global Name Servers", Passive and Active Measurement (PAM2002), Fort Collins, CO, Mar 25-26, 2002.
- The following poster paper was accepted for presentation at the SIGMETRICS conference in June 2002: Nevil Brownlee and kc claffy. "Internet Stream Size Distributions."
- The following papers were submitted:
- Bradley Huffaker, Marina Fomenkov, Daniel J. Plummer, David Moore and k claffy "Distance Metrics in the Internet" to the International Telecommunications Symposium (ITS2002) in Natal, Brazil.
- David Moore, Colleen Shannon and kc claffy "Characteristics of Fragmented Traffic on Internet Links" to SIGCOMM.
- The following presentations were given:
- "CAIDA's Macroscopic Topology Project" at SAINT Jan 2002
- "Internet expansion, refinement, and churn" at NANOG Feb 2002
- "Internet measurement: myths about Internet data" at NANOG Feb 2002
- "Fundamental Limits on Blocking Self-Propagating Code" at CSTB The Internet Under Crisis Conditions Workshop Mar 2002
13.0 FINANCIAL INFORMATION:
Contract #: N66001-01-1-8909
Contract Period of Performance: 5 Jun 2001 to 5 Jun 2004
Ceiling Value: $ 2, 924, 958
Current Obligated Funds: $2, 924, 958
Reporting Period: 1 Jan 2002 to 31 Mar 2002
Actual Costs Incurred: $ 775, 203
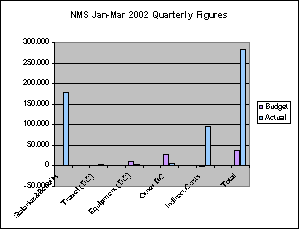
Current Period:
| UCSD | ||
| Labor Hours: | 5262.8 | $ 178, 063 |
| ODC's: | $ 10, 077 | |
| IDC's: | $ 95, 552 | |
| TOTAL: | $ 283, 692 |
Cumulative to date:
| Labor Hours: | 11, 800.6 | $ 471, 858 |
| ODC's: | $ 37, 904 | |
| IDC's: | $ 253, 585 | |
| TOTAL: | $ 775, 203 |
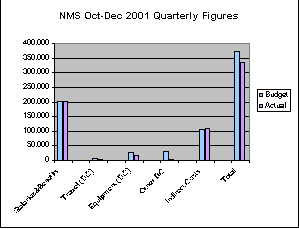
Revised Cost Curves for Oct - Dec 2001:
|  |
Cost Curves for Jan - Mar 2002:
|  |
![Go to CAIDA home page [CAIDA - Center for Applied Internet Data Analysis logo]](/images/caida_globe_faded.png)
