|
SPAWARSYSCEN - SAN DIEGO e-mail address: nms@spawar.navy.mil Technical Representatives {nik,rafael}@spawar.navy.mil Maureen Battern Contracting Officer SPAWARSYSCEN SAN DIEGO CONTRACTS D212 PHONE 619-553-4489 FAX 619-553-7822 battern@spawar.navy.mil |
|
University of California, San Diego (UCSD) 9500 Gilman Drive La Jolla, CA 92093-0505 Dr. Kimberly Claffy PHONE 858-534-8333 FAX 858-822-0861 kc@caida.org Contract/Financial Contact Pamela J. Alexander PHONE 858-534-0240 FAX 858-534-0280 pjalexander@ucsd.edu |
Quarterly Status Report #Qtr2
Macroscopic Internet Data Collection and Analysis in Supportof the NMS Community
1.0 Purpose of Report
This status report is the quarterly cooperative agreement report that summarizes the effort expended by the UCSD's Cooperative Association for Internet Data Analysis (CAIDA) program in support of SPAWARSYSCEN-SAN DIEGO and DARPA on Agreement N66001-01-1-8909 during Oct - Dec 2001.
2.0 Project Members
| UCSD hours: | |
| PI: | 215 |
| CAIDA Senior Staff: | 1657.7 |
| CAIDA Staff: | 3739.1 |
| Total Hours: | 5611.8 |
3.0 Project Description
This UCSD/CAIDA project focuses on advancing the capacity to monitor, depict, and predict traffic behavior on current and advanced networks, through developing and deploying tools to better engineer and operate networks and to identify traffic anomalies in real time. CAIDA will concentrate efforts in the development of tools to automate the discovery and visualization of Internet topology and peering relationships, monitor and analyze Internet traffic behavior on high speed links, detect and control resource use (security), and provide for storage and analysis of data collected in aforementioned efforts.
4.0 Performance Against Plan
(Please note: Changes since the last reporting period are in boldface
type, and links have been updated with new content.)
| Status | Task 1 Year 1 Milestones: | Notes |
|---|---|---|
| Progress | Add 5 additional skitter source sites | 3 new monitors (h-root, i-root, mw) activated this qtr. |
| Progress | Add 5 workload monitor sites | one new NeTraMet passive monitor added, dedicated to analyzing DNS service |
| Complete | Develop comprehensive website(s) for public availability of data |
|
| Status | Task 2 Year 1 Milestones: | Notes |
|---|---|---|
| Begun | Establish archive and interactive database for community access to skitter, mantra, routing, and CoralReef data. |
|
| Ongoing | Solicit community feedback regarding needed data types, formats, and dataset sizes. | Discussions occurred at IETF52, NANOG, and NMS PI Mtg in Atlanta |
| Ongoing | Work with the NMS community to design common experiments | Integrated CoralReef into RLBTS test lab demo |
5.0 Major Accomplishments and Results to Date
Task 1. Monitoring Task
A. Topology Measurement
Approach
skitter is a CAIDA tool that measures both the forward path and round trip time (RTT) to a set of destination hosts by sending probe packets through the network. It does not require any configuration or cooperation from the remote sites on its target list. In order to reveal global IP topology, the skitter project:
- Collects path and RTT data
- Acquires infrastructure-wide global connectivity information
- Analyzes the visibility and frequency of IP routing changes
- Visualizes network-wide IP connectivity
An essential design goal of skitter is to execute its pervasive measurement while placing minimal load on the infrastructure and upon final destination hosts. To achieve this goal, skitter packets are small (52 bytes in length), and we restrict the frequency of probing to 1 packet every 2 minutes per destination and 300 packets per second to all destinations. To improve the accuracy of its round trip time calculations, CAIDA added a kernel module to the FreeBSD operating system platform used by its skitter monitors. Kernel timestamping does not solve the synchronization issue required for one-way measurements, but reduces variance caused by multitasking processing when taking round trip measurements. This feature helps to capture performance variations across the infrastructure more effectively. By comparing data from various sources, we can identify points of congestion and performance degradation or areas for potential improvements in the infrastructure.
skitter Monitor Status as of 31-Dec-01 (21 monitors active):
(Changes since the last reporting period are in boldface type.)
| Status | skitter monitor name/location (org) |
|---|---|
| Running | DNS Clients list |
| Active | a-root.skitter.caida.org Herndon, VA, US (Verisign) |
| Active | d-root.skitter.caida.org College Park, MD, US (Univ. of Maryland) |
| Active | e-root.skitter.caida.org Moffett Field, CA, US (NASA) |
| Active | f-root.skitter.caida.org Palo Alto, CA, US (VIX) |
| New HW shipped | g-root.skitter.caida.org Vienna, VA, US (NIC.mil) |
| Active | h-root.skitter.caida.org Aberdeen, MD, US (US Army Research Lab) |
| Active | i-root.skitter.caida.org Stockholm, Sweden (Autonomica) |
| Active | k-peer.skitter.caida.org Amsterdam, North Holland, NL (RIPE) |
| Active | k-root.skitter.caida.org London, UK (RIPE) |
| HW on order | l-root.skitter.caida.org Marina del Rey, CA, US (ISI) |
| Active | m-root.skitter.caida.org Tokyo, Kanto, JP (WIDE) |
| Active | sjc.skitter.caida.org San Jose, CA, US (MFN) |
| Active | yto.skitter.caida.org Ottawa, CA (CANet) |
| Running | IPv4Addr BGP Prefix list |
| Active | lhr.skitter.caida.org London, UK (MFN) |
| Active | mw.skitter.caida.org San Jose, CA (Worldcom) |
| Active | skitter.uoregon.edu Eugene, OR, US (Univ. of Oregon) |
| Active | waikato.skitter.caida.org Hamilton, NZ (Univ. of Waikato) |
| Configuring SW | ams-skt-01.carrier.net Amsterdam, North Holland (Carrier 1) |
| Configuring SW | ams-vu.skitter.caida.org Amsterdam, North Holland (Vrije Univ.) |
| Configuring SW | fra-skt-01.carrier1.net Frankfurt. DE (Carrier 1) |
| Configuring SW | lon-skt-01.carrier1.net London, UK (Carrier 1) |
| Running | Small list |
| Active | champagne.caida.org Urbana, IL, US (VBNS) |
| Running | Web Servers list |
| Active | apan-jp.skitter.caida.org Tokyo, Kanto, JP (APAN) |
| Active | iad.skitter.caida.org Washington, DC, US (MFN) |
| Active | nrt.skitter.caida.org Tokyo, Kanto, JP (MFN) |
| Active | riesling.caida.org San Diego, CA, US (CAIDA) |
| Active | skitter.kaist.kr.apan.net Taejon, KR (APAN) |
| Not running | any list |
| Deactivated | chenin.caida.org Boulder, CO, US (NCAR) |
| Deactivated | galahad.caida.org Ann Arbor, MI, US (CAIDA) |
| Deactivated | nyc-engr-01.inet.ipwest.net New York, NY, US (Qwest) |
| Deactivated | sin.skitter.caida.org Singapore, SG |
| Deactivated | sjo-engr-01.inet.qwest.net San Jose, CA, US (Qwest) |
Analysis Results: Distance Metrics in the Internet
CAIDA has performed a study for distance estimation between two hosts located on the Internet. Researchers need to develop a metric that is both computationally inexpensive and provides a relatively accurate measure of distance. Comparisons of metrics can be directly applied to problems such as locating the closest mirror to a given host.
Distance were estimated among nine CAIDA monitors worldwide. We computed four metrics by analyzing data from our skitter estimation tool using two destination lists:
- the IPv4 list that attempts to probe one IP address in each routable /24
- the DNS list where destinations are derived from each BGP prefix in a list of known DNS clients
Using this data we computed four metrics:
- Round trip time (RTT) was generated by our skitter probes.
- Geographical distance was computed between hosts using IPMapper and great circle distances.
- IP path length is computed by adding 1 to the number of IPs that skitter sees a packet traverse between source and destination.
- Autonomous System (AS) path length is equal to the number of different ASes a packet traverses
Distributions of Distance
IP and AS path length distributions are unimodal and skewed to higher values. RTT distributions are typically bi- or tri-modal where the clusters are the result of aggregations of geographical locations, specifically those areas separated by continental boundaries. The RTT distributions also have heavy tails. These results demonstate a correlation of increasing RTT times with increasing geographical distances.
Comparisons of Distance Metrics
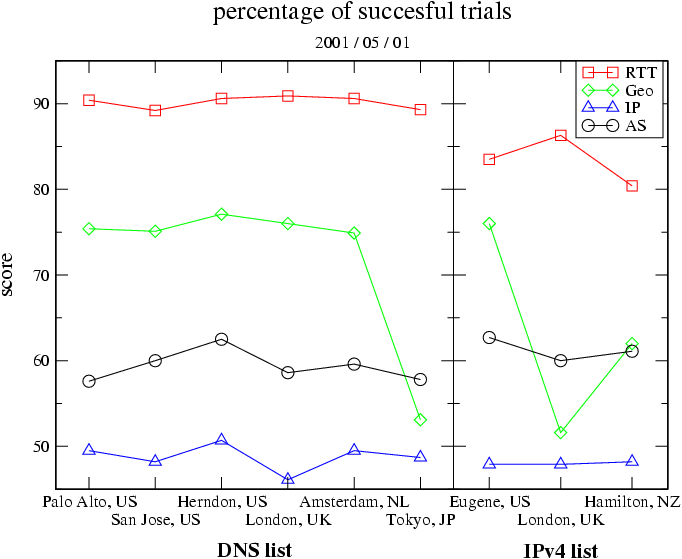
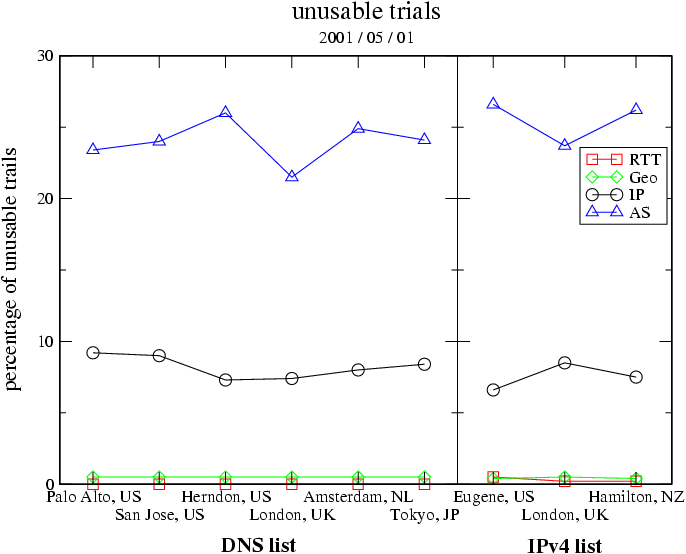
Evaluation of the predictive values of each metric yielded the following results (Refer to Figures 1 and 2.):
- AS path length. This metric has a predictive value of 60% (chance level). This is likely the result that AS pathlength distributions have a sharp peak around a mean value with a very small variance. This resulted in 20% of trials having identical lengths.
- IP path length. With a predictive value of only 50% (chance level), this metric has no predictive value.
- Geographical location. This metric typically has a predictive value of approximately 75% but this value can drop to chance levels when crossing a continental boundary (e.g. locations like Tokyo have no predictive value when compared to London or San Jose).
- RTT. With predictive values approaching 90% overall, RTT proves to be a useful metric for estimating distances.
Trends
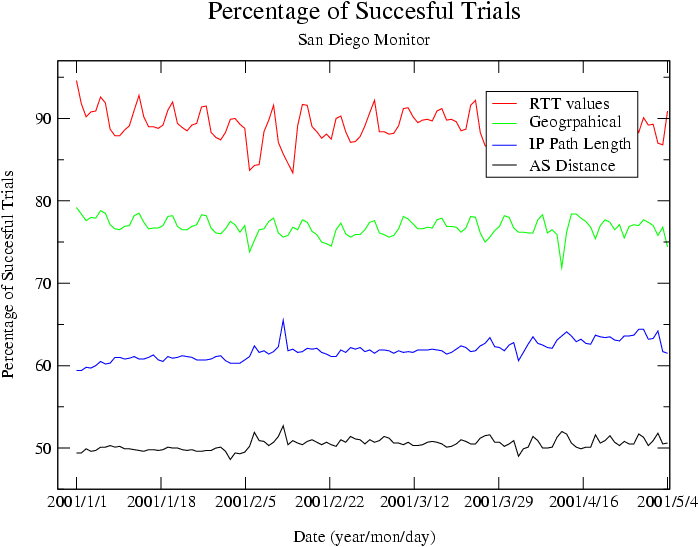
Figure 3. Success rates for the different metrics across servers April 5th, 2001
While the geographical locations of servers typically remain constant, IP and AS path lengths frequently vary over time in response to network infrastructure changes. Our results comparing IP and AS path lengths were equivocal. A fraction of path lengths increase over time (AS = 20%; IP = 40%), some decrease (AS = 20%; IP = 30%) while the rest remained constant (AS = 60%; IP = 30%).
Preliminary analyses of trend data for predictive values of our four metrics suggest that while there are both daily and weekly variations, the mean values for RTT (90%), geographical location (77%) and AS distance (50%) remain constant (Figure 3). In contrast, the IP path length appears to increase slightly (from 59% to 64%) during the same period.
Conclusions
These results suggest that the RTT metric provides the most predictive value as a distance metric. Neither AS nor IP path length provide a predictive value significantly above chance.
Other ongoing skitter analysis projects:
- https://www.caida.org/tools/measurement/skitter/sample_code/
- https://www.caida.org/tools/visualization/otter/otter_plots/all_iad.png
- skitter daily summaries archive: http://sk-summary.caida.org/cgi-bin/main.pl
- skitter data access for researchers: https://www.caida.org/data/skitter/skitter_data_use.xml
New IP Interface Discovery Tool (iffinder)
Version 1.36 of the iffinder was released to CAIDA members. iffinder discovers which IP interfaces belong to the same router.New 3D Graph Visualization Tool (walrus)
Alpha version 0.1 of walrus was released on 5 Dec 01.B. Workload Measurement
OC48 Traces were successfully captured from the Metromedia Fiber Network (MFN) backbone in San Jose, CA. Data was provided to CAIDA from the WAND Research Group (University of Waikato, New Zealand) using their deployed OC48 DAG interface card. Analysis results (provided below) used CAIDA's CoralReef software suite.
OC48 data was also used by Nevil Brownlee to compare stream sizes on OC3 (Auckland), OC12 (UCSD) and OC48 (MFN) links. This analysis was used in the poster paper "Internet Stream Size Distributions" which was accepted for presentation at the SIGMETRICS conference in June 2002.
CoralReef Software Suite:
In November, we released version 3.5.1 of the CoralReef software package to CAIDA members and the public. This major new release adds support for NLANR TSH file formats; parses IEEE 802.1Q VLAN; parses ARP for Ethernet and ATM; partially parses ILMI and SNMP; recognizes (but does not parse) IGMP, IEEE 802.1D, AppleTalk, AARP, and IPX protocols. Multiple improvements were made to the make procedure and device configuration as well as to applications, the C API (libcoral) and Perl APIs.
For additional details, see https://www.caida.org/tools/measurement/coralreef/doc/doc/CHANGELOG.
NeTraMet Software Development:
Machine netramet.caida.org was configured to record DNS response times. It started recording data 30 Sep 01. Data collection was interrupted on 19 Nov 01 due to failure of the DAG interface hardware and resumed on 4 Dec 01 after the broken hardware was replaced.
Perl programs were developed to make strip charts from NeTraMet flow data files. The Perl "distributions" library was used.
Analysis Results: Workload Characterization of an OC48 Link
Traffic volume
The following table provides summary statistics for the total amount of data captured in the 10/29/2001 trace:| Direction = 0 | Direction = 1 | |
| Total IP Bytes | 94,196,921,960 | 158,653,821,008 |
| Total IP Packets | 254,498,642 | 268,633,066 |
| Duration of trace (in seconds) | 3779.99 | 3779.99 |
Fragmentation statistics
The traces revealed an expected level of fragmentation of packets.
| Direction = 0 | Direction = 1 | |
| Fragments of IP Datagrams | 906,976 | 1,329,267 |
| non-IP Packets | 0 | 0 |
| Fragments of TCP Datagrams | 35,112 | 8485 |
| Fragments of UDP Datagrams | 271,737 | 1,192,944 |
Stratification by protocol
The follwing table provides a stratification of traffic by protocol as a function of both bytes and packets. As expected, the trace is dominated by TCP traffic. There are also very small amounts of traffic from other protocols (not included).
| protocol | Direction = 0 total | Direction = 0 percentage | Direction = 1 total | Direction = 1 percentage |
| 6 (packets) | 225,581,759 | 88.64 | 249,401,371 | 92.84 |
| 6 (bytes) | 88,933,849,471 | 94.41 | 152,030,205,798 | 95.83 |
| 17 (packets) | 24,500,521 | 9.67 | 16,148,997 | 6.01 |
| 17 (bytes) | 4,302,659,885 | 4.57 | 6,009,666,513 | 3.79 |
| 50 (packets) | 945,614 | 0.37 | 422,884 | 0.16 |
| 50 (bytes) | 591,595,712 | 0.63 | 145,536,398 | 0.09 |
| 1 (packets) | 3,005,049 | 1.18 | 1,753,504 | 0.65 |
| 1 (bytes) | 272,187,857 | 0.29 | 151,779,830 | 0.10 |
| 47 (packets) | 369,051 | 0.15 | 857,313 | 0.32 |
| 47 (bytes) | 50,609,692 | 0.05 | 304,596,714 | 0.19 |
Distribution of Packet Sizes
The following two figures illustrate a curious asymmetry between the two interfaces on the dag card. The packet sizes, as shown in the cumulative distributions below, are larger for interface 0 than for interface 1. This may suggest that one location in (in general) used more for "servers" (e.g. locations in the US) while the other direction may represent "clients".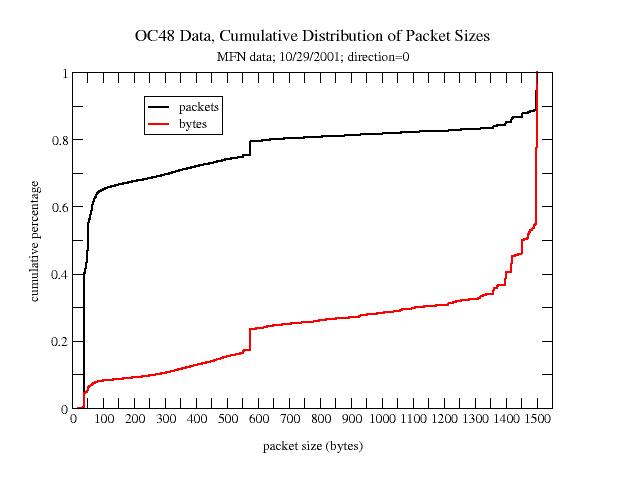 | 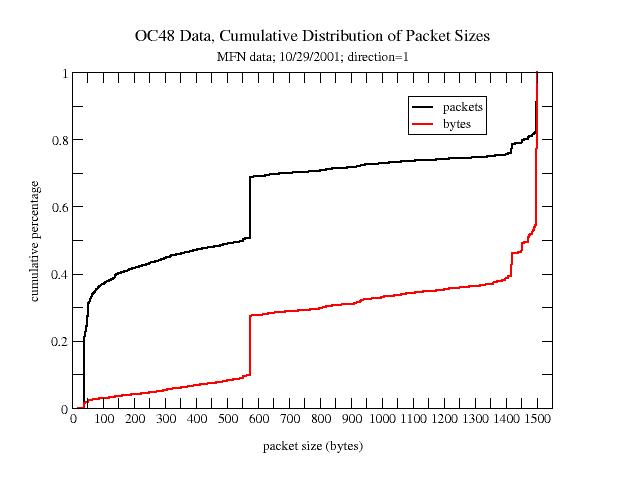 |
| Figure 4a. Direction=0 | Figure 4b. Direction=1 |
Figure 4. OC48 Data, Cumulative Distribution of Packet Sizes
Breakdown of Data by Application
Using port mapping techniques in conjunction with our CoralReef software suite, we infer application for each incoming packet. The following table shows the breakdown of traffic in bytes stratified by application for the top 25 applications. (Complete analysis for all applications and analysis by packets and flows are available on the CAIDA website. On 10/29/2001, HTTP traffic dominates both directions of the trace, accounting for approximately two-thirds of all traffc. Peer-to-peer applications (e.g. EDONKEY, FASTTRACK) comprise a significant portion of the remaining traffic. Much of the data cannot be classified either because port values did not map to any known locations or because the applications negotiated alternate ports. Graphical versions of this data for bytes, packets, flows, bytes per flow and packets per flow can also be found at the CAIDA website.| Direction = 0 Applications | Direction = 0 Percentage Traffic | Direction = 1 Applications | Direction = 1 Percentage Traffic |
| "HTTP" | 64.6045026821577 | "HTTP" | 68.7010183555618 |
| "Unclassified_TCP" | 8.01134330058046 | "Unclassified_TCP" | 8.7457099992928 |
| "FASTTRACK" | 5.0458111571841 | "NNTP" | 7.09626279405059 |
| "EDONKEY_TCP" | 4.75352464276911 | "Unclassified_UDP" | 2.20710267171632 |
| "SMTP" | 2.36687861202089 | "MS_MEDIA" | 1.96477569843575 |
| "NNTP" | 1.89117559488833 | "SMTP" | 1.92645692363411 |
| "Unclassified_UDP" | 1.85510647577211 | "FASTTRACK" | 1.51342608706175 |
| "FTP_DATA" | 1.84897718844783 | "EDONKEY_TCP" | 1.40687680889121 |
| "NAPSTER_DATA" | 1.55954289037173 | "FTP_DATA" | 1.10825935360397 |
| "HTTPS" | 1.18235413254798 | "HTTPS" | 1.02073810766107 |
| "GNUTELLA" | 1.05993656565551 | "GNUTELLA" | 0.665967072207905 |
| "MS_MEDIA" | 0.955163184631447 | "DNS" | 0.460641975087647 |
| "REALAUDIO_UDP" | 0.809711011576365 | "REALAUDIO_UDP" | 0.450991964769584 |
| "DNS" | 0.714261151760352 | "RTSP" | 0.424914521440454 |
| "ESP" | 0.628041444921098 | "No_Ports_UDP" | 0.29831701499529 |
| "HALFLIFE" | 0.404702459386093 | "NAPSTER_DATA" | 0.249296014429404 |
| "ASHERONS" | 0.292724426813012 | "SHOUTCAST" | 0.202948476122415 |
| "RTSP" | 0.291683267527574 | "POP" | 0.198257394621825 |
| "SHOUTCAST" | 0.228345868880939 | "GRE" | 0.191988260982307 |
| "No_Ports_UDP" | 0.149610440561954 | "HALFLIFE" | 0.181734464382894 |
| "STARCRAFT" | 0.132567611922606 | "ICU_II" | 0.123032209372582 |
| "POP" | 0.108166995095657 | "SSH" | 0.10681994924547 |
| "SQUID" | 0.10643628037018 | "ESP" | 0.0917320490612832 |
| "ICMP_ECHO" | 0.0783906718310817 | "IRC" | 0.0780234601347765 |
| "IRC" | 0.0695572812878111 | "QUAKE" | 0.0774389422202377 |
Source / Destination Traffic Analysis
We examined traffic patterns between countries and regions of the world using CAIDA's NetGeo interface to infer locations of IP addresses within countries using RouteViews BGP tables. We assign each packet to a source/destination pair and, using xrt3d, plot the absolute values for traffic from each pair. There are distinct differences between values for the two interfaces. We have plotted traffic values in bytes between regions of the world. The data from direction 1 shows that North America (in particular the US) is the dominant source for data by orders of magnitude. Direction 0 data reveals a somewhat more balanced mix with a number of regions as sources.
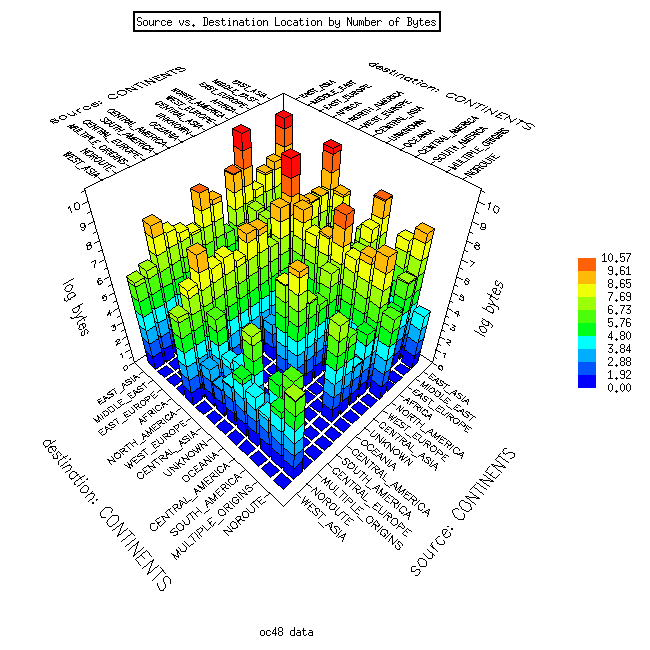 | 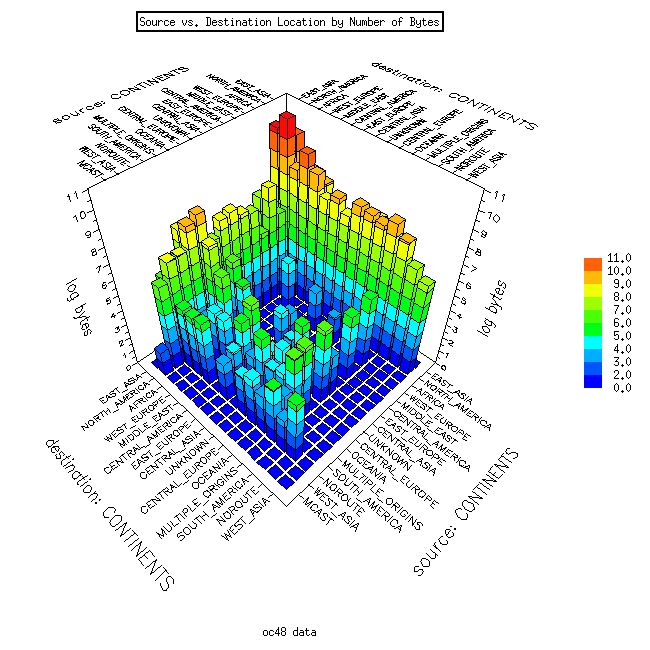 |
| Figure 5a. Direction=0 | Figure 5b. Direction=1 |
Figure 5. OC48 Data, Source vs. Destination Continent by Number of Bytes
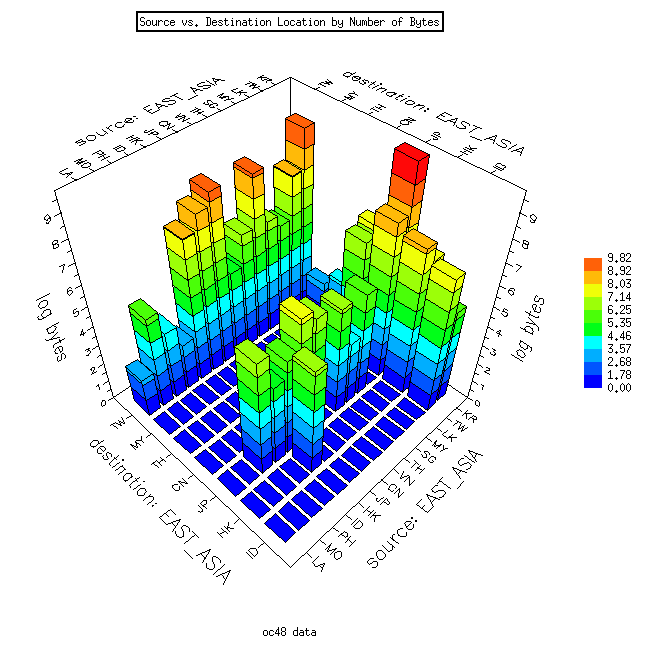
The following table shows results which may seem paradoxical. Both source and destination countries are within eastern Asian countries. However, this traffic passes through San Jose. We have found this to be true for virtually all regions of the world. Traffic is routed through the US even from bordering countries within Europe and Asia.Figure 6. OC48 Data, Source vs. Destination in East Asia by Number of Bytes
In addition to our xrt3d graphs, we have plotted these source/destination matrices using CAIDA's interactive GeoPlot tool. Rather than using a three-dimensional program, GeoPlot represents both source and destination locations as nodes and the traffic between nodes as links. Moving the mouse over the links shows the relative flow of traffic for a given source/destination pair. This provides the user with an interactive demonstration. We have generated GeoPlot analyses for all regions of the world. These results can be found on the CAIDA webpage.C. Routing Measurement
Analysis Results: Invariants in Internet Routing
Our analysis of routing systems has revealed a number of results that contradict dogma about the Internet. In particular, many measures of routing system complexity have demonstrated slow growth, dynamic equilibrium, and occasional contraction over the last several years. Furthermore, our results suggest that despite the flux there are invariants in the Internet.
We refute a number of commonly held assumptions about Internet growth:
- Contrary to existing operational opinion, most growth in prefixes between late 2000 and mid-2001 occurred in top prefixes (i.e. those prefixes that are not more specifics) and was caused by four sources: allocation (55%), deaggregation(37.5%), expansion(5%) and aggregation(2.6%).
- The number of semiglobal prefixes was stable from October to February 2002, compared to 37% growth between November 2000 and November 2001.
- AS path length (both the mean and the overall distribution) did not significantly change between 1999 and 2001. Link/node ratio (average degree) and peering richness of the BGP AS graph also did not significantly change between November 2000 and May 2001 although individual ASes often exhibited a high degree of change.
- Prefix set churn during 2001 was much higher than prefix growth rate. The churn was highest for more specific prefixes. AS and IP address churn was smaller but still comparable to their net growth. More specific prefixes constitute half of the entries in global BGP tables. Their proportion grew from 50% in November 1999, to 55% in November 2000, and then decreased to 52% by November 2001.
- As of November 2001, multihomed networks (transit or non-transit) are not significantly more likely to announce more specific prefixes than non-multihomed networks.
- The number of non-transit multihomed ASes grew from 46% to 49% from 2000 to 2001, but their share of global routes remained stable at around 30%.
- 40% of ASes originate only a single prefix. These ASes contribute 5% of all Internet routes. Only 1% of ASes originate 100 or more routes. These ASes contribute 32% of all routes in the global BGP table. The disparity between contributions by different classes of providers to the BGP table dramatically contradicts prevailing wisdom.
- Half of the routing instability in the form of withdrawal/reannouncement events in late 2001 is contributed by 1.2% of all (12,422 active) ASes. Government networks, telecoms in developing countries and major backbone ISPs are the top contributors. Small ASes (those originating a few prefixes) do not contribute disproportionately to the BGP table size or to instability of the global routing system.
These analyses suggest that many Internet metrics were stable and that Internet growth and instability originate mainly in large and medium-sized ISPs, not small ISPs. These results imply that current operational thinking, which currently focuses on controlling the `explosive' inter-domain routing growth, and views the contribution of smaller (and/or non-transit) ASes as dominant, deserves reexamination. Experts in the operational routing as well as research communities suggest that the recent contraction in routing table growth and churn is the direct result of more careful management of the routing system.
Task 2, Archiving and Storage Task
Approach for Archiving skitter Data
- CAIDA provides interactive access to skitter daily summaries on its public web site at: http://sk-summary.caida.org/cgi-bin/main.pl.
- CAIDA grants access to archived skitter data to researchers who agree to our Acceptable Use Policy. Summaries of their skitter-related research projects can be found at: https://www.caida.org/data/skitter/skitter_data_use.xml.
Analysis of skitter Data
Between Oct and December, 2001 the following researchers requested access to skitter data:
- Giuseppe Di Fatta - CERE-CNR (Palermo, Italy)
- Braden Kowitz - University of illinois-Urbana-Champaign
- Shetal Shah - IITB (ac, India)
- Lev Tsimring - UCSD
- Viktor Grichenko - Ural State University (Yekaterinburg, Russia)
- Ruomei Gao - Georgia Institute of Technology
- Min-Ho Sung - Georgia Institute of Technology
- Mike Sips - University of Konstanz (Germany)
- Craig Donner - UCSD
Approach for Archiving CoralReef Data
- CAIDA provides a demonstration of CoralReef data collection, analysis, and reporting at: https://www.caida.org/dynamic/analysis/workload/sdnap/. Results are updated every 5 minutes.
- CAIDA archives CoralReef data for special purpose studies as needed, but must limit data collection to available disk space.
6.0 Artifacts Developed During the Past Quarter
None7.0 Issues
None8.0 Near-term Plan
The following work is planned for 01-Jan-01 through 31-Mar-01:
General/Administrative Outreach and Reporting Plans
- Submit Quarterly Report to SPAWAR covering progress, status and management.
Task 1. Monitoring Task Plans
- A. Topology Measurement
- B. Workload Measurement
- CAIDA will continue to analyze traces gathered from OC48 links at Metromedia Fiber Network (MFN) in San Jose,
- Refinement of the CoralReef software suite will continue, (https://www.caida.org/tools/measurement/coralreef/ ) especially concerning improving the CoralReef Report Generator tool https://www.caida.org/tools/measurement/coralreef/components.xml#HTML as well as optimizing interoperability with NeTraMet and Narus software.
- Web pages will be developed to dynamically display RTT and loss rate strip charts for Root and gTLD servers. Scripts to automatically generate the charts will be needed to support these web pages. Additionally, NeTraMet data collection scripts will be extended to send email upon detecting a collection failure.
- C. Routing Measurement
CAIDA will continue to collect and analyze data from the skitter project.
CAIDA will continue to refine methodology and results from ongoing routing studies.
Task 2, Archiving and Storage Task Plans
- We will continue to collect and analyze data collected from skitter sources deployed in the field
- We will continue to make skitter topology and performance data available to researchers via Certificate Authority for use in their research and monitor results. See: https://www.caida.org/data/skitter/skitter_data_use.xml
- We will continue briefings to the Internet community on the purpose and results of skitter active monitoring and will solicit their feedback.
- We will continue to re-design the structure and user interface of skitter daily summaries to improve quality of access to collected data. See: http://sk-summary.caida.org/cgi-bin/main.pl
- We will make additional improvements on the Walrus viewer. See: https://www.caida.org/tools/visualization/walrus/ We will add the ability to load a more complete file format, add more filtering and other interactive processing, and add rendering labels and other attributes for nodes and links.
9.0 Completed Travel
The following travel occurred during Year 1, 1-Oct-01 through 31-Dec-01:
- Andre Broido and Nevil Brownlee 12/8 IETF 52 Workshop, Salt Lake City, UT
- Nevil Brownlee 10/31 - 12/18 work in San Diego, present at Usenix LISA, attend ISMA
- kc claffy 10/23 - 10/28 DARPA NMS PI Meeting, Atlanta, GA. k summarized relevant NANOG information for group.
- kc claffy 10/14 - 10/17 IEEE CCW Workshop Charlottesville, VA
Other related travel occurred but was not charged to this award.
10.0 Equipment Purchases and Description
Hardware for two skitter monitors was purchased. In addition, a high-end PC laptop suitable for running CAIDA's Java3D walrus (See https://www.caida.org/tools/visualization/walrus/") visualization tool was purchased for PI kc claffy, who also uses it while on travel and for giving presentations.
11.0 Significant Events
- Wrote a statement of work for a proposed collaboration with Rolf Riedi of Rice University. Submitted proposal to Sri Kumar.
- Advised Cisco on Netflow architecture for next generation routers hardware and software.
- Gave George Cybenko advice for his report on infrastructure security.
- Met with Sri Kumar one-on-one to discuss NMS plans, including possible integration with his biotech work. Followed up on his leads, but none panned out.
- Andre Broido presented a talk on "Internet stability amid change" at the ISMA Winter 2001 Workshop. https://www.caida.org/publications/presentations/BGP2001dec/ He was also invited to present this talk to the IETF ptomaine working group.
- k claffy presented CAIDA's current DNS measurement and analysis results to RSSAC.
- Nevil Brownlee previewed his LISA DNS measurement talk at the IEPG Meeting in London on Aug 5.
- k claffy presented a talk at the Tarifica Bandwidth Seminar in Hong Kong, November 2001. https://www.caida.org/publications/presentations/bw0111/.
12.0 Publications:
- The following papers were presented at the Usenix LISA Conference in San Diego, CA Dec 2-7, 2001:
- Moore, D., Keys, K., Koga, R., Lagache, E. and claffy, k., "CoralReef software suite as a tool for system and network administrators".
- Fomenkov, M., claffy, k., Huffaker, B. and Moore, D., "Macroscopic Internet Topology and Performance Measurements From the DNS Root Name Servers".
- Brownlee, N., claffy, k. and Nemeth, E., "DNS Root/gTLD Performance Measurements".
- Evi Nemeth presented the following paper at the Globecomm Conference
27Nov, 2001 San Antonio, TX:
- Brownlee, N., k claffy, and E. Nemeth. "DNS Measurements at a Root Server." https://www.caida.org/publications/papers/2001/DNSMeasRoot/"
- The following papers were accepted for presentation:
- Broido, A., Nemeth, E., and k claffy. "Internet Expansion, Refinement, and Churn" accepted for the ETT journal. https://www.caida.org/publications/papers/2002/EGR/
- Brownlee, N. and k claffy. "Internet Stream Size Distributions" accepted as poster for SIGMETRICS 13-19 June, 2002 Marina del Rey, CA.
- Huffaker, B., Moore, D. and k claffy. "Topology Discovery by Active Probing." accepted for SAINT conference 28Jan-1Feb, 2002, Nara, Japan. https://www.caida.org/publications/papers/2002/SkitterOverview/"
13.0 FINANCIAL INFORMATION:
Contract #: N66001-01-1-8909
Contract Period of Performance: 5 Jun 2001 to 5 Jun 2004
Ceiling Value: $ 2, 924, 958
Current Obligated Funds: $2, 924, 958
Reporting Period: 1 Oct 2001 to 31 Dec 2001
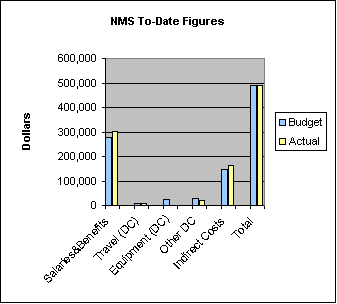
Actual Costs Incurred: $ 491, 511
Current Period:
| UCSD | ||
| Labor Hours: | 5611.8 | $ 201, 658 |
| ODC's: | $ 24, 308 | |
| IDC's: | $ 108, 292 | |
| TOTAL: | $ 334, 258 |
Cumulative to date:
| Labor Hours: | 6537.8 | $ 301, 612 |
| ODC's: | $ 27, 836 | |
| IDC's: | $ 162, 063 | |
| TOTAL: | $ 491, 511 |
Cost Curves to date:
|  |
![Go to CAIDA home page [CAIDA - Center for Applied Internet Data Analysis logo]](/images/caida_globe_faded.png)
