![]()
![]()
| Time range | 2014-01-12 00:01 to 2014-01-13 17:40 UTC (1 day 18 hours) (2669 days ago) |
| Total traces | 26638 |
| Traces with responding destinations | 0 (0.000%) |
| ASes with responding destinations | 0 (0.000% out of 6739) |
| Prefixes with responding destinations | 0 (0.000% out of 12069) |
| Protocol version | v6 (switch to v4) |
Generated for cycle 18006 on 2014-01-14 10:10 UTC
All images can be clicked on for more detailed information.
Median RTT per country and US state
Mapping RTT by political boundaries can reveal where high latency issues are located.
-
Median RTT per country and US state
Path Dispersion
The paths taken by different traces show where the majority of a monitor's traffic travels.
-
AS Path Dispersion (by AS Hop)
 AS connectivity near monitor
-
AS Path Dispersion (by IP Hop)
 AS connectivity near monitor (with IP hop distances preserved)
-
IP Path Dispersion (by IP Hop)
 IP connectivity near monitor
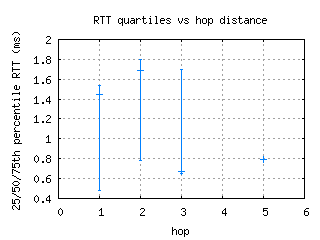
RTT Distribution
An RTT distribution shows the general latency between a monitor and the rest of the Internet.
-
RTT quartiles vs hop distance
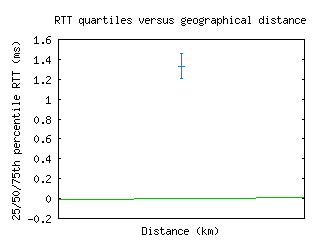
RTTs vs. Distance
Comparing RTT with geographical distance helps show if latency is primarily due to distance or other factors.
-
RTT density versus geographical distance
-
RTT quartiles versus geographical distance