![[CAIDA - Center for Applied Internet Data Analysis logo]](https://www.caida.org/images/caida_globe_faded.png "Go to CAIDA home page")
![]() Archipelago (Ark): CAIDA's active measurement infrastructure serving the network research community since 2007.
Archipelago (Ark): CAIDA's active measurement infrastructure serving the network research community since 2007.
| Time range | 2018-07-30 14:24 to 2018-07-31 01:39 UTC (11 hours) (1009 days ago) |
| Total traces | 112816 |
| Traces with responding destinations | 14781 (13.102%) |
| ASes with responding destinations | 5459 (35.501% out of 15377) |
| Prefixes with responding destinations | 13260 (25.284% out of 52444) |
| Protocol version | v6 (switch to v4) |
Generated for cycle 116668 on 2018-08-27 23:35 UTC
All images can be clicked on for more detailed information.
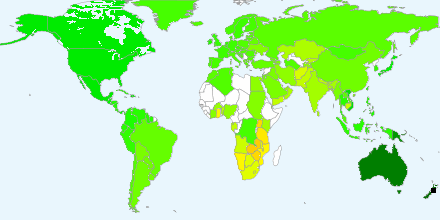
Median RTT per country and US state
Mapping RTT by political boundaries can reveal where high latency issues are located.
-
Median RTT per country and US state
Path Dispersion
The paths taken by different traces show where the majority of a monitor's traffic travels.
-
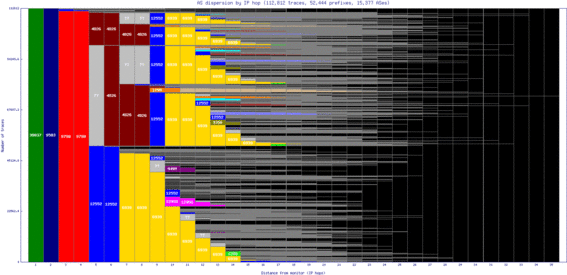
AS Path Dispersion (by AS Hop)
 AS connectivity near monitor
-
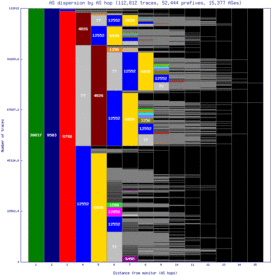
AS Path Dispersion (by IP Hop)
 AS connectivity near monitor (with IP hop distances preserved)
-
IP Path Dispersion (by IP Hop)
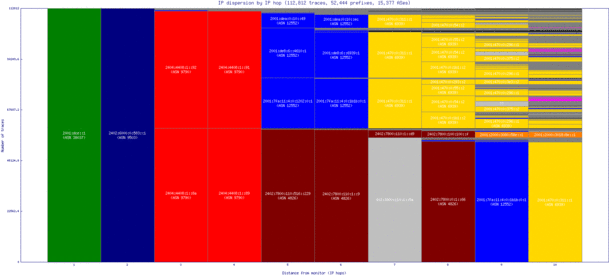 IP connectivity near monitor
Path Length Distributions
Path length distributions show, on aggregate, how well-connected a monitor is to the rest of the Internet.
-
CCDF of IP path lengths for responding destinations
percentile 10th 25th 50th 75th 90th Max IP path length 12 14 16 18 20 34 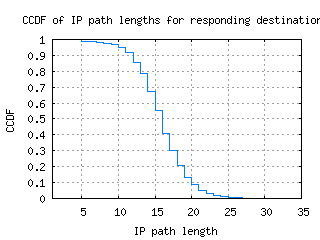
-
CCDF of AS path lengths for responding destinations
percentile 10th 25th 50th 75th 90th Max AS path length 7 8 9 10 11 15 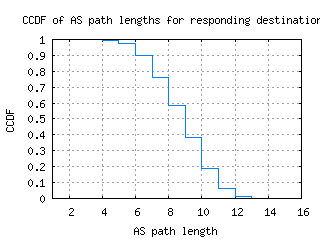
-
CCDF of IP path lengths for non-responding destinations
percentile 10th 25th 50th 75th 90th Max IP path length 11 13 15 18 20 35 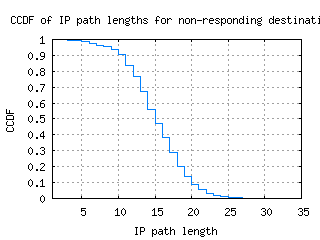
-
CCDF of AS path lengths for non-responding destinations
percentile 10th 25th 50th 75th 90th Max AS path length 6 7 8 9 10 15 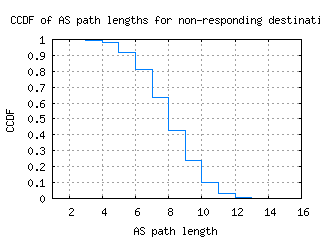
-
CCDF of destination RTTs
percentile 10th 25th 50th 75th 90th RTT (ms) 162.668 220.085 299.521 335.453 378.827 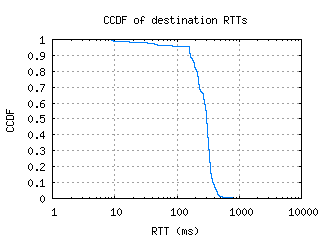
-
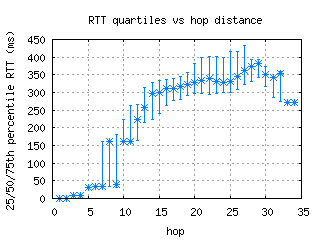
RTT quartiles vs hop distance
-
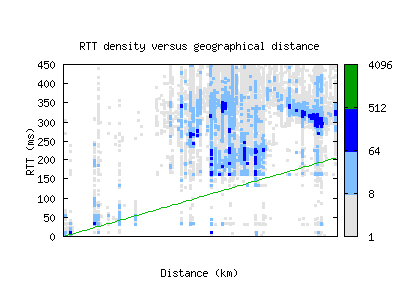
RTT density versus geographical distance
-
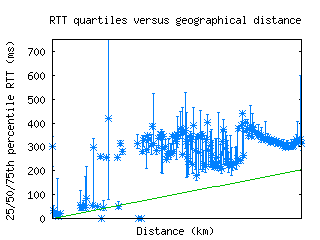
RTT quartiles versus geographical distance