![[CAIDA - Center for Applied Internet Data Analysis logo]](/images/caida_globe_faded.png "Go to CAIDA home page")
Project Title:``Bandwidth Estimation: Measurement Methodologies and Applications''
Project Website: http://www.caida.org/projects/bwest and http://www.pathrate.org/
Check one:
[X] SciDAC Project
[ ] MICS/Base Project
PIs:
kc claffy
Institution:
CAIDA/SDSC/UCSD
Constantinos Dovrolis
Institution:
Georgia Tech
Check one:
[ ] 1st Quarterly Report Date:
[ ] 2nd Quarterly Report Date:
[ ] 3rd Quarterly Report Date:
[ ] 4th Quarterly Report Date:
[X] Annual Report Date: June 10, 2003
P
ROJECT
A
BSTRACT
The ability for an application to adapt its behavior to changing network conditions depends on the underlying bandwidth estimation mechanism that the application or transport protocol uses. As such, accurate bandwidth estimation algorithms and tools can benefit a large class of data-intensive and distributed scientific applications. However, existing tools and methodologies for measuring network bandwidth metrics, (such as capacity, available bandwidth, and throughput) are mostly ineffective across real Internet infrastructures.
We propose to improve existing bandwidth estimation techniques and tools, and to test and integrate them into DOE and other network infrastructures. This effort will overcome limitations of existing algorithms whose estimates degrade as the distance from the probing host increases. Existing VPS (Variable Packet Size) and PTD (Packet Train Dispersion) probing techniques will be studied as well as novel algorithms and methodologies as they become available. As we improve algorithms, we will incorporate this knowledge into an integrated tool suite that offers insights into both hop-by-hop and end-to-end network characteristics. We will also investigate mechanisms for incorporating bandwidth measurement methodologies into applications or operating systems, so that the applications quickly reach the highest throughput a path can provide. Finally, we will examine ways in which routing protocols, traffic engineering, and network resource management systems can use accurate bandwidth estimation techniques in order to improve overall network efficiency.
S
UMMARYOFACCOMPLISHMENTS
Main accomplishments at CAIDA/SDSC/UCSD:
- Refinement of Tool Testing methodology: We improved our lab environment and configuration and devised better methods for generating realistic yet reproducible simulated cross-traffic. We also automated test data collection and improved our capabilities for independently measuring and graphing cross-traffic and tool traffic using a NeTraMet passive monitor.[ 1 ]
- Analysis of E2E bandwidth estimation tools on both 100Mbps and GigEther links: Results of our experiments reveal several factors that affect tool accuracy including: the presence of layer-2 store and forward devices; differences in the size of internal router queues; and high cross-traffic loads. All of these conditions are likely to occur in the Internet in the wild, making the job of end-to-end bandwidth estimation more complex.
- Application of Internet spectroscopy techniques to link capacity characterization: We began to investigate a new technique for revealing characteristics of layer-2 technologies without requiring additional traffic probes. Internet spectroscopy is based on an algorithm where a radon transform of inter-packet delay distributions is coupled with entropy minimization.[ 2 ]
- Testbed sharing with other DOE bandwidth estimation researchers: After long and arduous troubleshooting in which we discovered and resolved multiple hardware, software, router, and network configuration issues, we opened up our bwest test lab for use by DOE collaborators.
Main accomplishments at Georgia Tech:
- Pathrate and Pathload in Gigabit paths: In April 2003, we released a new version of our bandwidth estimation tools, Pathrate and Pathload. Pathrate 2.3.0 measures end-to-end capacity (a.k.a., bottleneck bandwidth), while Pathload 1.1.0 measures end-to-end available bandwidth. The latest versions improve the accuracy of the tools, and extend the bandwidth measurement range up to 1Gbps.
- Socket buffer sizing for maximum TCP throughput: Bandwidth estimation can significantly improve the throughput of large TCP transfers, such as the transfers of large scientific data sets. We have developed an application-layer technique, called SOcket Buffer Auto-Sizing (SOBAS) , that helps TCP to achieve its maximum feasible bandwidth in a network path. SOBAS does not require changes in TCP. The key idea behind SOBAS is to limit the socket buffer size, and thus the maximum TCP send-window, to the point that the transfer saturates the network path without causing packet losses.
- Autonomous NEtwork Monitoring System (ANEMOS): We have developed ANEMOS, a network monitoring system that allows end-users to schedule, perform, and analyze active measurements on several network paths through a Web-based GUI. The measurements can be performed by ``off-the-shelf'' tools, such as Ping or Pathload. The measurements are archived using the MySQL database, and they can be visualized using MRTG . A major feature of ANEMOS is that it supports rules, post-processing, and alarm detection.
- Passive capacity estimation: Most current bandwidth estimation tools rely on active measurements. Active probes interfere with normal network traffic and are to some degree intrusive . We therefore developed an alternative passive capacity estimation methodology based on packet dispersion techniques. Our technique uses a trace of network traffic collected from a link to estimate its capacity from the distribution of TCP connections traversing that link.
- Available bandwidth estimation methodology: Our available bandwidth estimation paper, entitled ``End-to-End Available Bandwidth: Measurement methodology, Dynamics, and Relation with TCP Throughput'', has been selected as one of the best papers of the SIGCOMM 2002 proceedings, and it will appear in the August 2003 issue of the IEEE/ACM Transactions in Networking journal.
Joint accomplishments:
- Survey on bandwidth estimation: Over the last few years, there has been significant progress in the area of bandwidth estimation. More than a dozen of software tools have been written, claiming that they measure different bandwidth metrics using different methodologies. We have written a survey paper which describes the key developments in this area over the last few years. The paper[ 3 ], to be published in IEEE Network , presents a taxonomy of the currently available tools, emphasizing their main differences and similarities.
- The effect of layer-2 switches on some bandwidth estimation tools: We showed (in [ 4 ] and [ 5 ] as well as experimentally (See Figure 5 ) that some bandwidth estimation tools, specifically Pathchar , Pchar , and clink , give erroneous results when the measured paths include layer-2 store-and-forward switches. Since many paths and modern routers contain such layer-2 devices, these bandwidth estimation tools should be avoided. Their results may be consistently and significantly different than the true capacity of the measured paths.
D
ESCRIPTIONOFACCOMPLISHMENTS
1 Refinement of GigEther testbed and methodology
Last year, our baseline tool test results were so inaccurate that it was logical to question our testbed configuration and traffic generation strategies. We put significant effort towards devising more realistic traffic generation and troubleshooting subtle infrastructure problems. Several improvements resulted: We acquired permanent (rather than loaned) GigEther router hardware and reconfigured the testlab with a 3-hop GigEther path. After thorough consideration of [ 6 ] [ 7 ] [ 8 ], and [ 2 ], we established the following goals:
- Cross-traffic characteristics should be reproducible and consistent across varying load utilizations.
- To be realistic, cross-traffic should exhibit a wide range of packet inter-arrival times. Figure 1 shows a wide range of inter-arrival gaps across cross-traffic loads from 10 - 90%.
- An IP packet size distribution matching IMIX[ 9 ] is desirable. IMIX derives from analysis of NLANR traces and is tri-modal (e.g., 58% at 40 bytes, 18% at 576 bytes, and 23% at 1518 bytes). Figure 2 shows tri-modal packet size distributions across cross-traffic loads from 10 - 90%.
At the same time, we improved our NeTraMet based passive traffic monitoring capabilities [ 1 ] in order to be able to prove existing experimental conditions. We also upgraded firmware on SmartBits 6000 hardware, changed TeraBit cards, and installed a new, improved SmartFlow application that includes IMIX support. Finally, we improved our test automation and traffic analysis and visualization capabilities. All of these new capabilities allow us to prove our experimental conditions and give more accurate feedback to bandwidth estimation tool developers.
One significant result of our improved infrastructure can be seen in Figure 3 . Here, the deviation between packet inter-arrival times (IATs) when tools are running can be distinguished from when tools are not running. Therefore, we see that bandwidth estimation tools are filling in longer packet inter-arrival gaps.
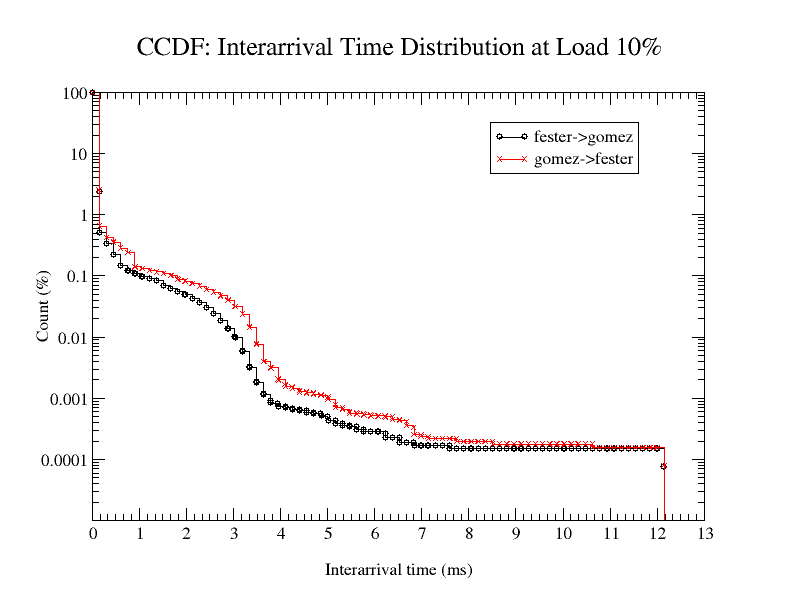

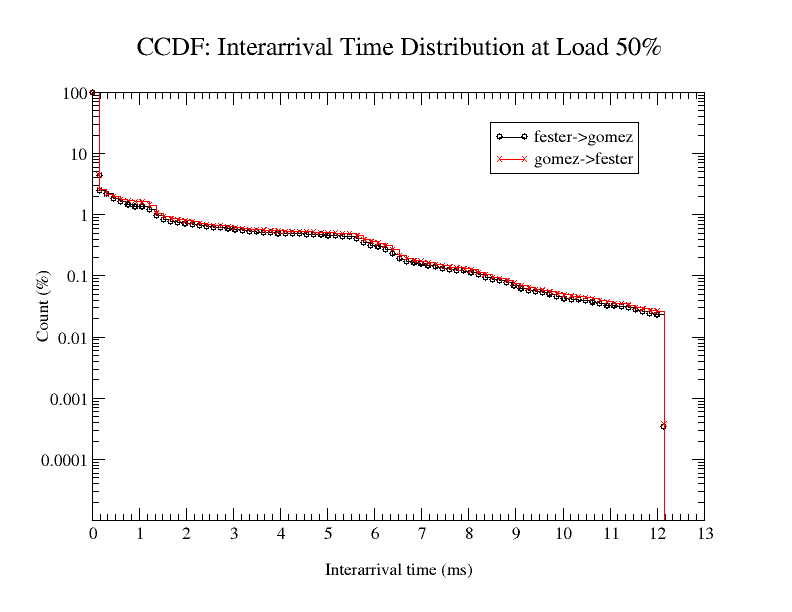
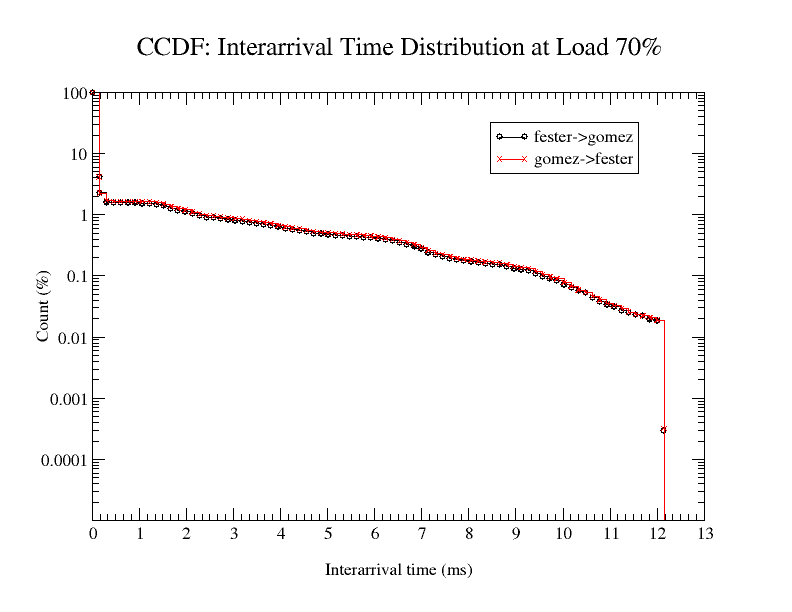
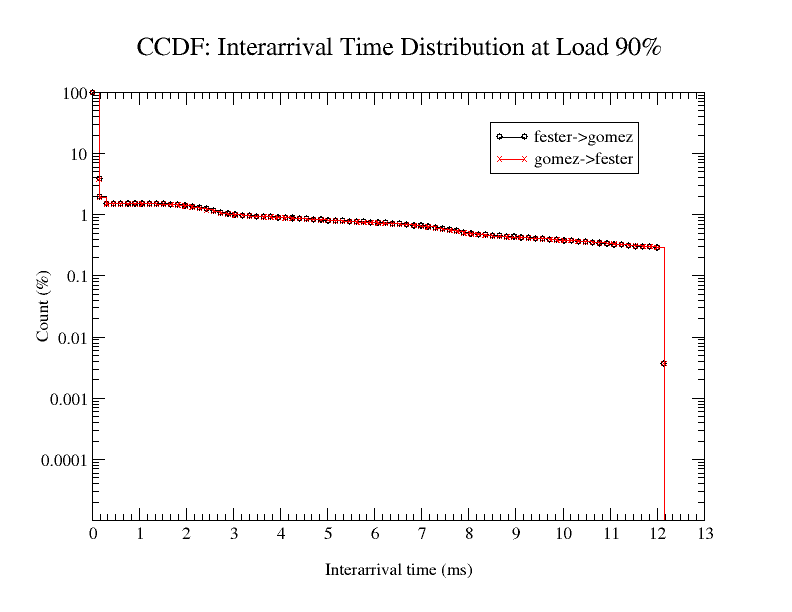
Figure 1: These plots show the CCDF of packet inter-arrival times produced by the SmartBits 6000 traffic generator with the SmartFlow application. Eighty fixed bins from 1 to 12000 microseconds were used to plot CCDFs at different cross-traffic loads, Cross-traffic clearly contains a desirable wide spread range of packet inter-arrival times. Notice that the curve starts to level off as the cross-traffic load increases, as we would expect because fewer larger interarrival gaps can occur.
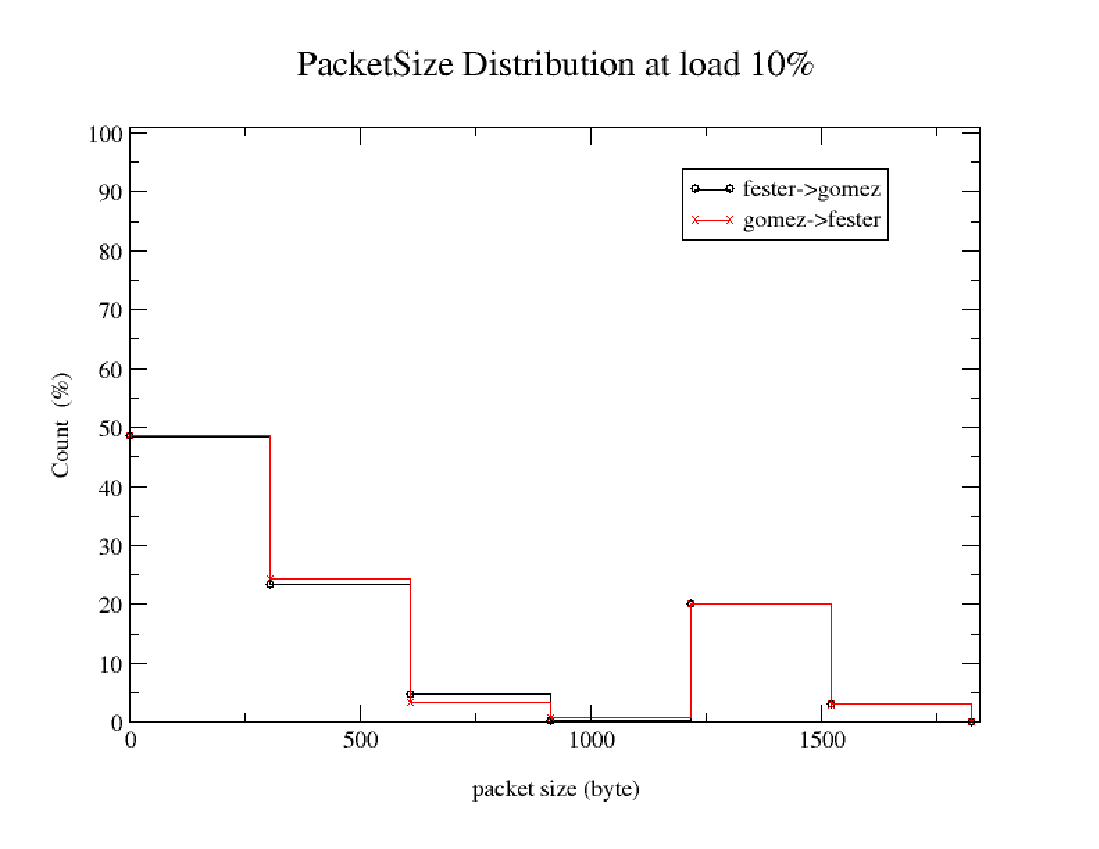
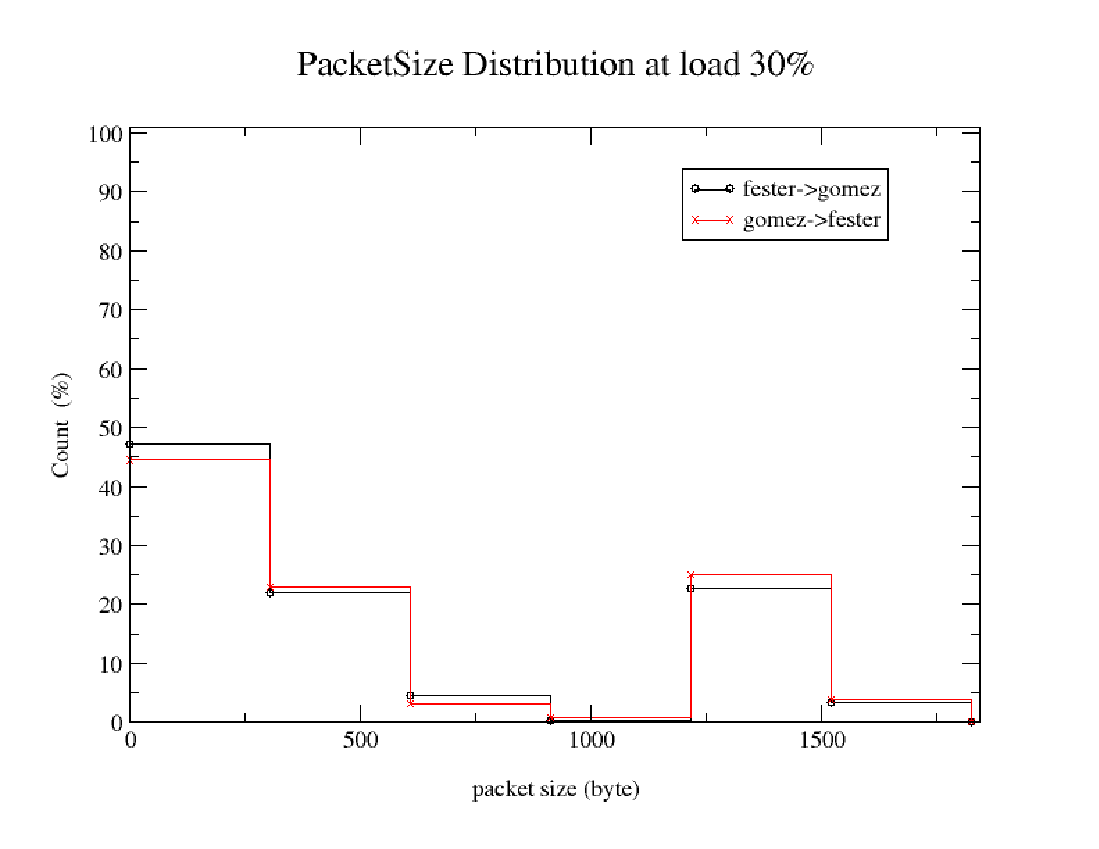
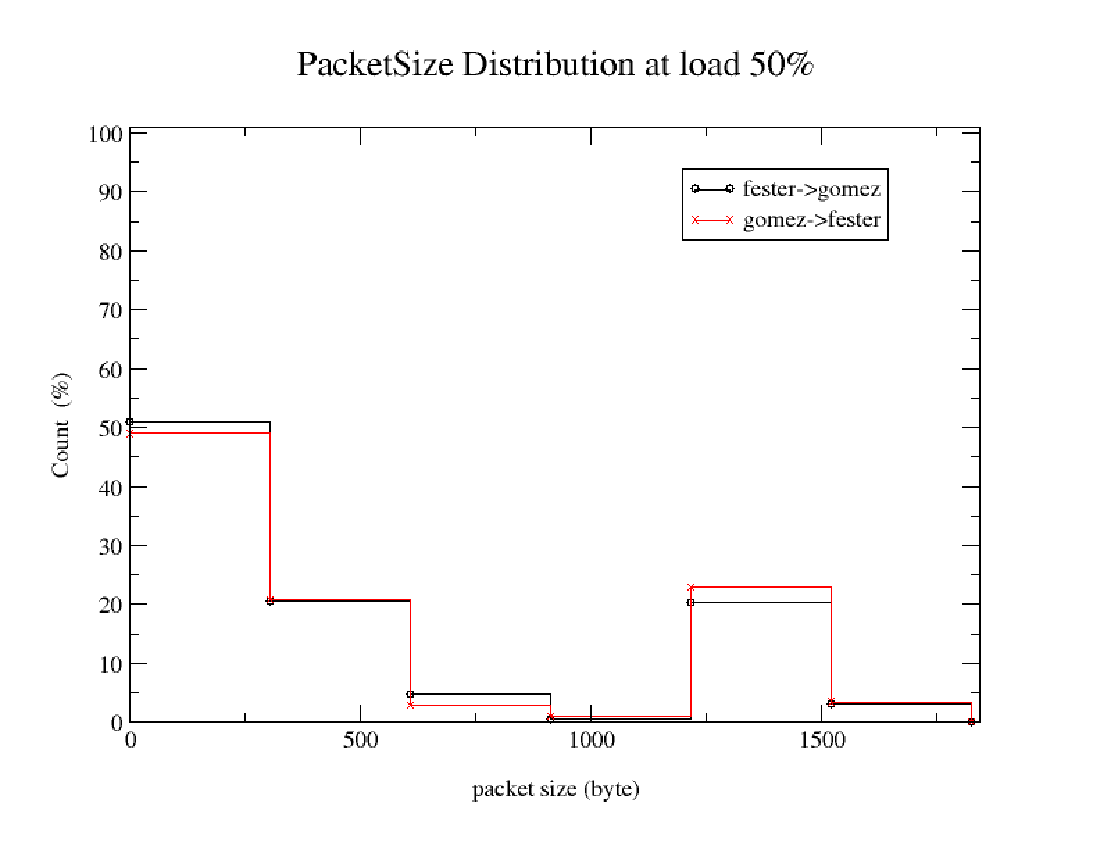
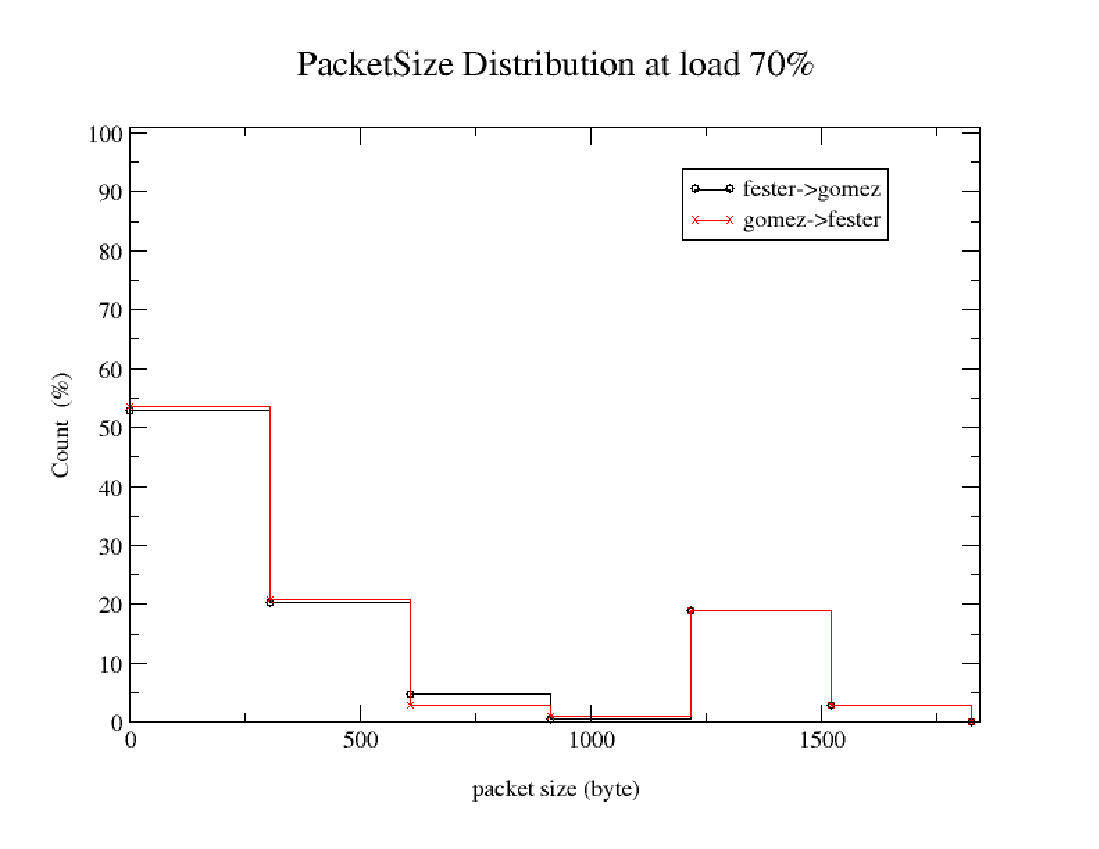
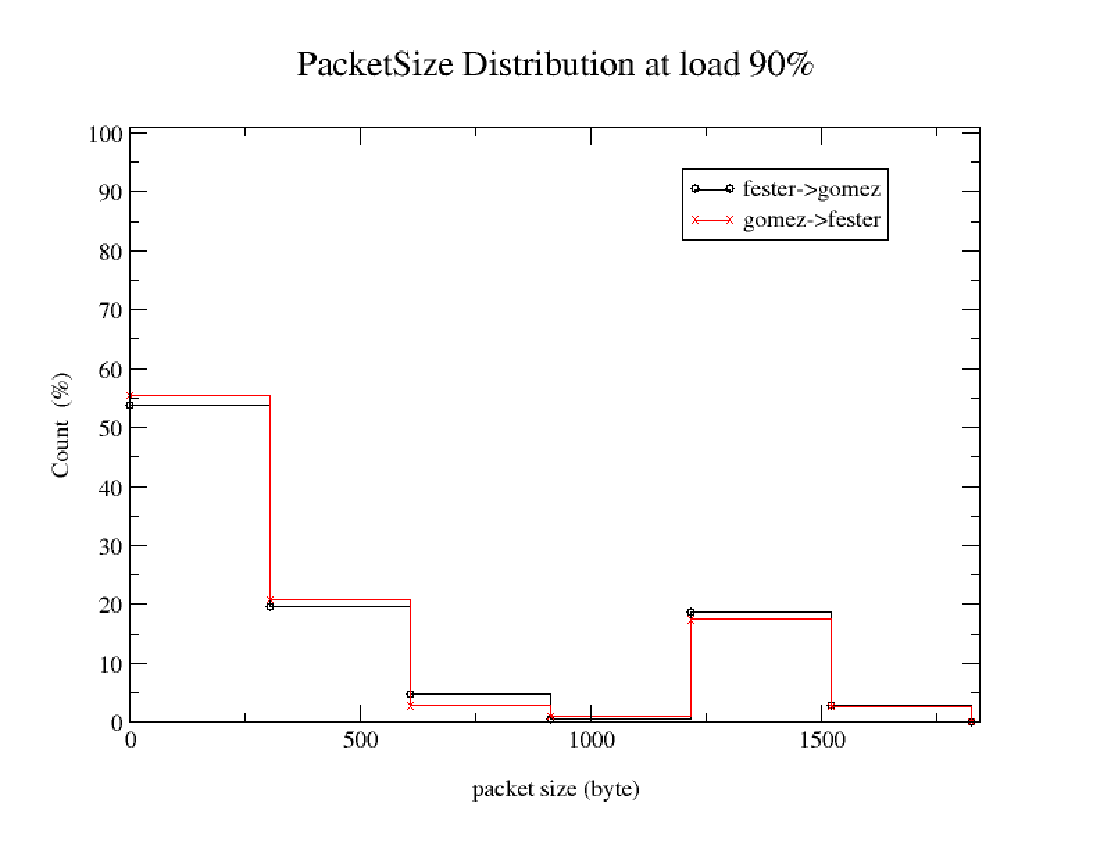
Figure 2: These plots show the distribution of packet sizes produced by the SmartBits 6000 traffic generator using an IMIX flow configuration option in the SmartFlow application. The majority of cross-traffic reflects a desirable tri-modal distribution at 64, 576, and 1518 byte packet sizes. These distributions occur consistently across all cross-traffic loads.
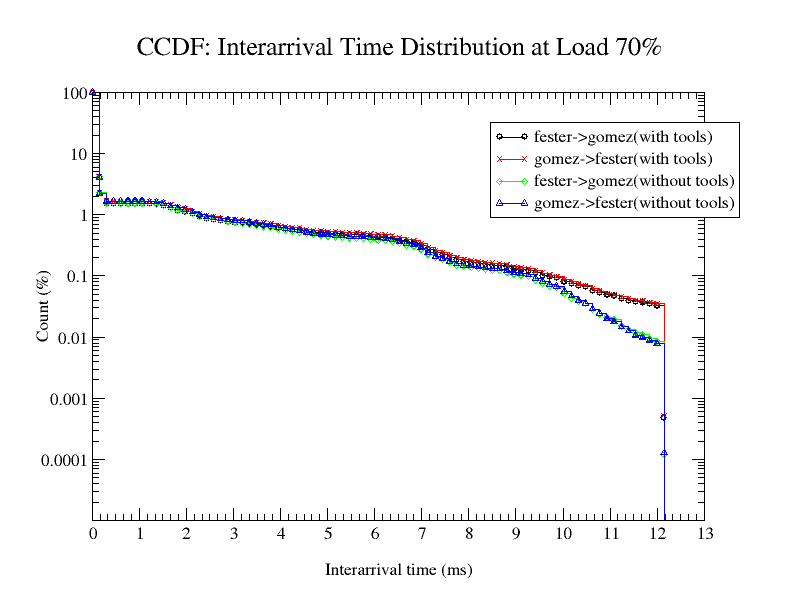
Figure 3: The tail of this plot is higher for cross-traffic with tool traffic than for cross-traffic alone. Traffic generated by the bandwidth estimation tools is fitting into the longer packet inter-arrival gaps, as expected. Overall, SmartFlow is currently configured to produce reasonably realistic traffic that is reproducible.
2 Bandwidth estimation tool testing results for 100M and GigEther paths
We completed another round ot testing of pathchar, pchar, pipechar, clink, iperf, treno, netest2, pathload, pathrate and sprobe on our CalNGI based Network Performance Reference Testbed. Reported results of most tools on our baseline 3-hop 100M path were surprisingly inaccurate. After rerunning tests and verifying experimental conditions, we conclude that pathchar, pchar, and clink are too erroneous to warrant any further testing. We also confirmed that pipechar is unresponsive to cross-traffic, so does not measure available bandwidth.
After completing tests in our controlled lab environment with simulated cross-traffic, we attempted to test the entire set of bandwidth estimation tools on a UCSD campus path between SDSC and the library. Unfortunately, a series of infrastructure changes, lack of access to SNMP counters from routers along the path, and generally low cross-traffic yielded incomplete and uninformative results. Instead, we now plan to run bandwidth estimation tools on the LBL 3-node ``real" testbed that traverses ISP connections.
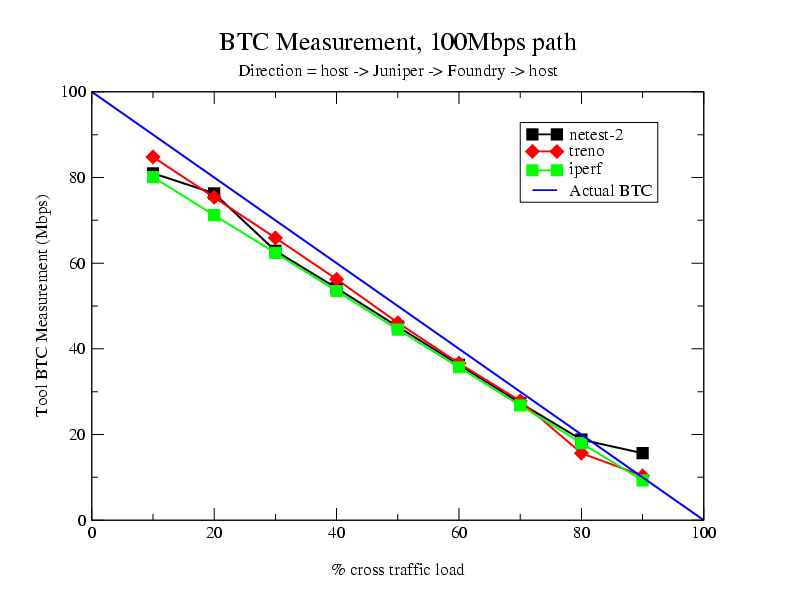
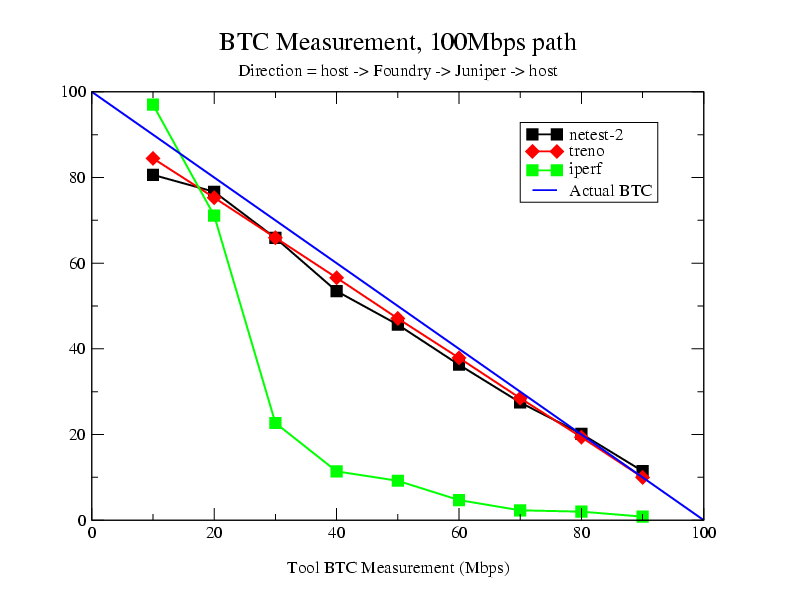
Figure 4: These two plots show different results on identical paths depending on what direction the bandwidth tools were run. We attribute these differences to the fact that the JuniperM20 router has a significantly larger queue buffer compared to the Foundry router.
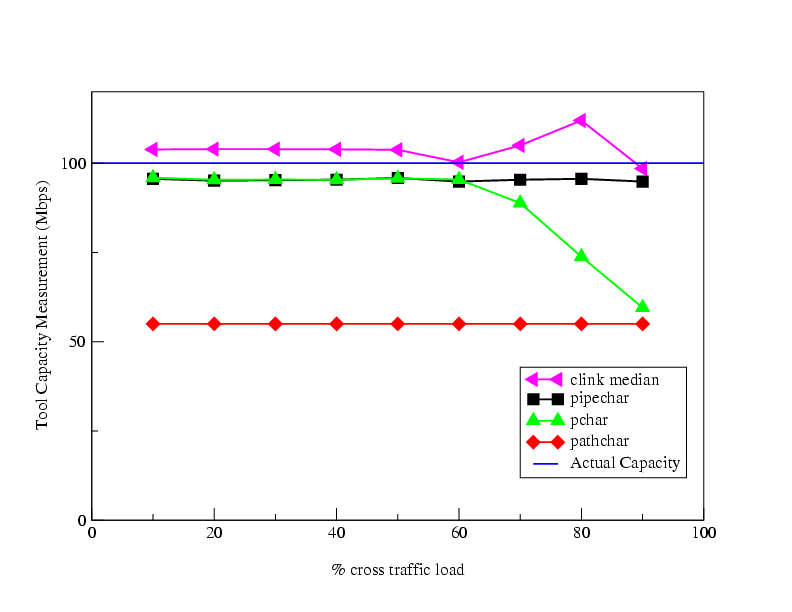
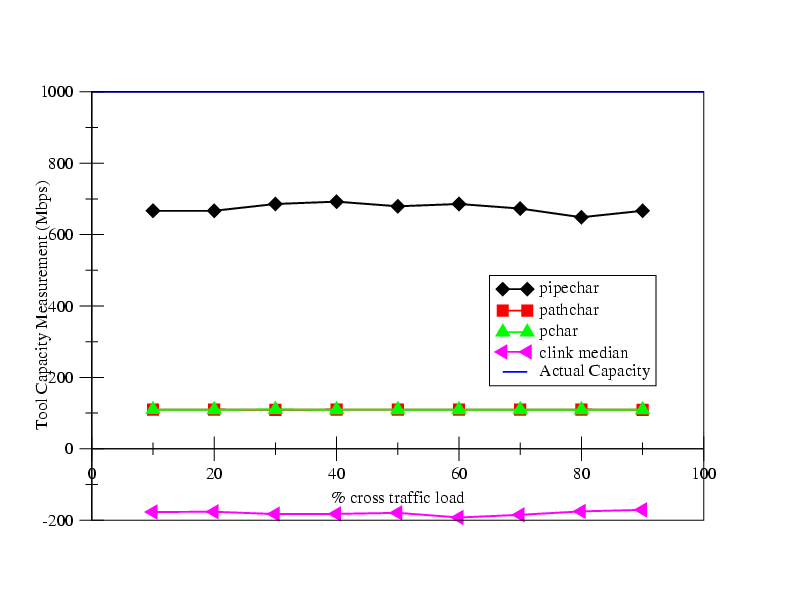
Figure 5: Layer-2 devices foil accuracy of some bandwidth estimation tools.
We are actively working with netest, pathrate, pathload, and pathchirp developers to verify our observed results and give feedback on how their tools work under our experimental conditions.
3 Application of Internet spectroscopy techniques to link capacity characterization
Our goal is to deduce the presence of layer-2 technologies such as ATM, rate-limited ATM, DSL, PPP, Ethernet and cable modems by extracting subtle yet characteristic features in IP backbone traffic from which we can identify provisioned bandwidth. CAIDA has been working on this technique since 2000[ 7 ] and just published a feasibility study to be presented this month at the High-Speed Networking (HSN) Workshop.[ 2 ] as well as in a poster at the prestigious ACM SIGMETRICS conference.[ 10 ]4 New release of Pathrate and Pathload
In April 2003, we released a new version of our bandwidth estimation tools, Pathrate and Pathload. Pathrate 2.3.0 measures end-to-end capacity (a.k.a., bottleneck bandwidth), while Pathload 1.1.0 measures end-to-end available bandwidth.High-bandwidth paths, and in particular paths that are faster than roughly 500Mbps, present unique challenges in bandwidth measurement techniques. One main problem is the occurrence of interrupt coalescence in end-host Gigabit Ethernet interfaces. In the latest release of Pathrate and Pathload, we developed a technique to avoid this problem, exploiting the fact that interrupt coalescence is typically occurs only up to a certain number of packets. So, if a host receives more than that number of packets, it will be forced to generate multiple interrupts. Using this technique, we successfully tested the two tools in paths limited by OC-12 (640Mbps) and Gigabit Ethernet (1000Mbps) links.
Both tools are available at: http://www.pathrate.org
The major differences in the new versions of the tools are:Pathrate - 2.3.0
- The tool has been also tested in a number of OC-3 (155Mbps), OC-12 (640Mbps), and Gigabit Ethernet (1000Mbps) paths.
- We added functionality to deal with interrupt coalescence at the receiver. The basic technique is to detect interrupt coalescence by analyzing packet inter-arrivals. If interrupt coalescence is present, we force the receiver to generate multiple interrupts by sending longer packet streams.
- A ``quick termination'' mode was added for an estimate after just a few seconds. This is useful for frequent and light-weight measurements.
- Support for netlogger output format.
Pathload - 1.1.0
- The previous version was able to measure available bandwidth only in the 2-120Mbps range. The latest version was successfully tested in both low bandwidth paths (dial-up, DSL, cable modems), and in high bandwidth paths (OC-3, OC-12, GigEthernet).
- If interrupt coalescence occurs at the receiver, the tool reports a lower bound on the available bandwidth.
- The tool now automatically chooses an appropriate bandwidth resolution (previously this was a user-specified parameter).
- Support for netlogger output format.
Within the first two months of this new release, the distribution web site received more than 2000 hits.
5 Socket buffer sizing for maximum TCP throughput
There is significant recent interest in end-to-end performance over high bandwidth, long distance networks. In particular, the scientific community pushes the edge of network performance with applications such as distributed simulation, remote colaboratories, and multigigabyte transfers. Typically, such applications run over well provisioned networks (Internet2, ESnet, GEANT, etc) built with high bandwidth links (OC-12 or higher) that are lightly loaded most of the time. Additionally, through deployment of Gigabit Ethernet interfaces, congestion also becomes rare at network edges and end-hosts.With all this bandwidth, it is not surprising that users expect superb end-to-end performance. However, this is not always the case. A recent measurement study at Internet2 showed that 90% of the ``bulk'' TCP transfers (i.e., more than 10MB) receive less than 5Mbps [ 11 ]. It is widely believed that a major reason for the relatively low end-to-end throughput is TCP. This is either due to TCP itself (e.g., congestion control algorithms and parameters), or because of local system configuration (e.g., default TCP socket buffer size) [ 12 ].
Bandwidth estimation can significantly improve the throughput of large TCP transfers, such as the transfers of large scientific data sets. We have developed an application-layer mechanism that automatically adjusts the socket buffer size so that the TCP transfer receives its Maximum Feasible Throughput . The developed mechanism is called SOcket Buffer Auto-Sizing (SOBAS) mechanism. SOBAS estimates the MFT as the maximum TCP throughput measured by the receiving application. The basic idea in SOBAS is to limit the transfer's window, through socket buffer sizing, to the point that the transfer receives close to its MFT without causing packet losses when the path is non-congested . In congested paths, on the other hand, losses can also occur due to cross traffic, and so SOBAS does not limit the socket buffer size. We emphasize that SOBAS does not require changes in TCP , and that it can be integrated in principle with any TCP-based bulk data transfer application.
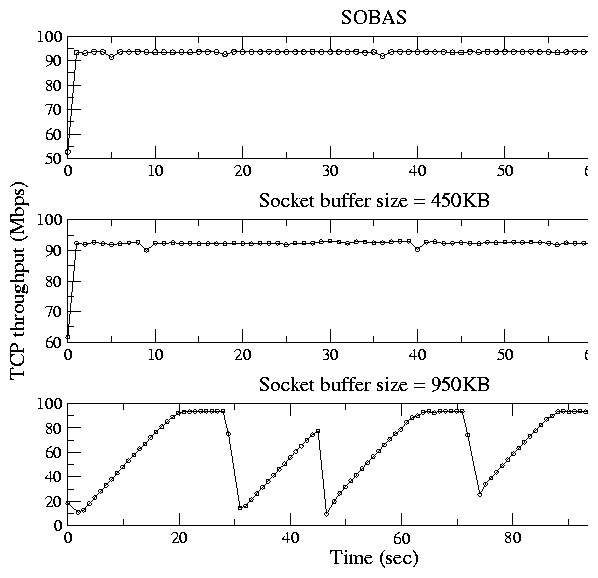
Figure 6: Throughput of an 800MB transfer with SOBAS, and with two static socket buffer sizes.
We have implemented SOBAS as a simple TCP-based bulk transfer application, and experimented with it at several Internet paths in US and Europe. In Figure 6 , we show the goodput of three successive 800MB transfers in a path from Georgia Tech to NYU. The capacity of the path is 100Mbps (layer 2), the Round-Trip Time is 37ms, and so the Bandwidth-Delay Product (BDP) is 436KB. The top graph of Figure 6 shows the goodput of the transfer using SOBAS. SOBAS detects rate saturation five seconds after the start of the transfer, and limits the receive socket buffer size to 559KB. Its average goodput (application layer) is 92.9Mbps.
The second graph of Figure 6 shows the goodput of the transfer when the socket buffer size is statically set to approximately the BDP (450KB). With this socket buffer size the transfer also manages to avoid losses, even though its throughput is slightly less than SOBAS (91.3Mbps). An important point is that this socket buffer selection was based on previous knowledge about the capacity and the RTT of the path. SOBAS, on the other hand, did not need this information.
Finally, the third graph of Figure 6 shows the goodput of the transfer when the socket buffer size is statically set to its maximum allowed value at the receiving host (950KB). This choice represents the popular belief in socket buffer sizing that ``larger is better''. Obviously this is not the case. The transfer experiences several bursty losses, resulting in a fairly low average throughput (59.8Mbps).
A paper describing SOBAS is currently under submission at the International Conference on Network Protocols (ICNP) 2003.
6 Autonomous Network Monitoring System (ANEMOS)
Active measurements of delays, losses, or available bandwidth are being widely used to monitor the end-to-end performance of a network path. Such measurements are often performed through rather primitive text-based tools, such as Ping , making the analysis, archiving, and visualization of the gathered data cumbersome. Our motivation in this part of the project is that a network operator or end-user should have the capability to schedule measurements of different metrics in several network paths through a flexible and simple graphical interface. The collection of underlying measurement tools should be extensible, allowing the user to ``plug-in'' additional tools as they become available, or configure the existing ones. The results of the measurements should be archived in a relational database that allows sophisticated queries, post-processing, and interactive visualization.Furthermore, we should not expect the user to constantly monitor the measurements, watching for sudden changes in the performance of a network path. Instead, the measurement system should be able to automatically analyze the collected data, based on user-specified rules, issuing alarms whenever the conditions of a rule are satisfied. Examples of such detectable conditions may include a sudden decrease in the available bandwidth of a path, or a significant increase in its Round-Trip Time (RTT). Alarms issued by the system can then be used to detect congestion, anomalies, attacks, or flash crowds. Alarms may also trigger changes in the configuration of overlay networks, or, in a more advanced version of the system, changes to the configuration of routers along the path.
With these goals in mind, we designed and implemented the Autonomous NEtwork MOnitoring System , or ANEMOS . ANEMOS has some similarities with other network monitoring tools or architectures, such as Pinger [ 13 ], Surveyor [ 14 ], or the Network Weather Service [ 15 ]. One major difference, however, is that ANEMOS provides rules and alarms. Specifically, the system evaluates user-specified rules on the collected data while the measurements are in progress, issuing alarms when the rule conditions are satisfied. Another difference is that ANEMOS has been designed for modularity and extensibility, allowing the user to plug-in and use any text-based measurement tool with minimal modifications in the ANEMOS software. Also, the user can request the measurements to be performed either in real-time, or to be scheduled as a batch process. All the interactions with the system are through a Web-based GUI.
We have installed ANEMOS on several hosts in the United States and Europe, including hosts at U-Delaware ( udel.edu ), CAIDA ( caida.org ), U-Wisconsin ( wisc.edu ), U-Vrije ( vu.nl ), U-Luleå ( luth.se ), and U-Crete ( uoc.gr ). To illustrate the use of rules and alarms, Figure 8 shows RTT variations in a 33-hour time period in three paths. The three graphs, from top to bottom, are the RTTs between U-Delaware and U-Crete, between U-Delaware and U-Vrije, and between U-Vrije and U-Crete. The rule that we specified is: check if the RTT between U-Delaware and U-Crete is greater than the RTT between U-Delaware and U-Vrije PLUS the RTT between U-Vrije and U-Crete . Such a rule, for instance, can determine the optimal routing between U-Delaware and U-Crete in a three-site overlay network that connects U-Delaware, U-Crete, and U-Vrije (see Figure 7 ).
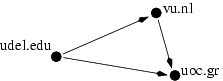
Figure 7: Topology of a possible ``detour'' at an overlay network
ANEMOS identified two time periods in which the previous rule was satisfied, issuing two alarms at around 7:30am and 9:30am EST at the right side of the graphs. The corresponding three RTTs that the alarm reported were: 297msec (U-Delaware, U-Crete), 141msec (U-Delaware, U-Vrije), and 147msec (U-Vrije, U-Crete) at the 7:30am event, and 302msec (U-Delaware, U-Crete), 141msec (U-Delaware, U-Vrije), and 132msec (U-Vrije, U-Crete) at the 9:30am event.
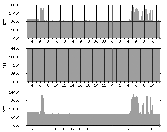
Figure 8: RTT measurements with ANEMOS
A paper describing ANEMOS has been published at the Passive and Active Measurements (PAM) 2003 conference [ 16 ]. ANEMOS is publicly available at http://www.cis.udel.edu/ danalis/ANeMoS.html .
7 Passive capacity estimation
Most currently bandwidth estimation tools use active measurements. This means that they interfere with the normal network traffic, and are to some degree intrusive. To avoid such intrusiveness, we therefore developed an alternative passive capacity estimation methodology based on packet dispersion techniques. Our technique uses a trace of network traffic collected from a link to estimate its capacity from the distribution of TCP connections traversing that link.Here, we summarize the statistical methodology that estimates the capacity of a TCP flow between the sender and the trace-collecting point using the timing of the flow's data packets. The methodology is based on the dispersion of packet pairs [ 17 ]. For each TCP flow f, let S f (i) be the size of the i'th data packet, and Df (i) be the dispersion measurement between data packets i and i+1. When packets i and i+1 are of the same size, we compute a bandwidth sample b i = S f (i)/ Df (i). Packets with different sizes traverse the network with different per-hop transmission latencies, and so they cannot be used with the packet pair technique [ 17 ].
Based on the delayed-ACK algorithm, TCP receivers typically acknowledge pairs of packets, forcing the sender to respond to every ACK with at least two back-to-back packets. So, we can estimate that roughly 50% of the data packets were sent back-to-back, and thus they can be used for capacity estimation. The rest of the packets were sent with a larger dispersion, and so will cause lower bandwidth measurements. Based on this insight we sort the bandwidth samples of flow f, and then drop the lower 50% of them. To estimate the capacity of flow f we employ a histogram-based method to identify the strongest mode among the remaining bandwidth samples; the center of the strongest mode gives the estimate [C\tilde] f . The bin width that we use is w = [2(IRQ)/(K 1/3 )] (known as ``Freedman-Diaconis rule''), where IRQ and K is the interquartile range and number, respectively, of bandwidth samples. We have verified this technique comparing its estimates with active measurements.
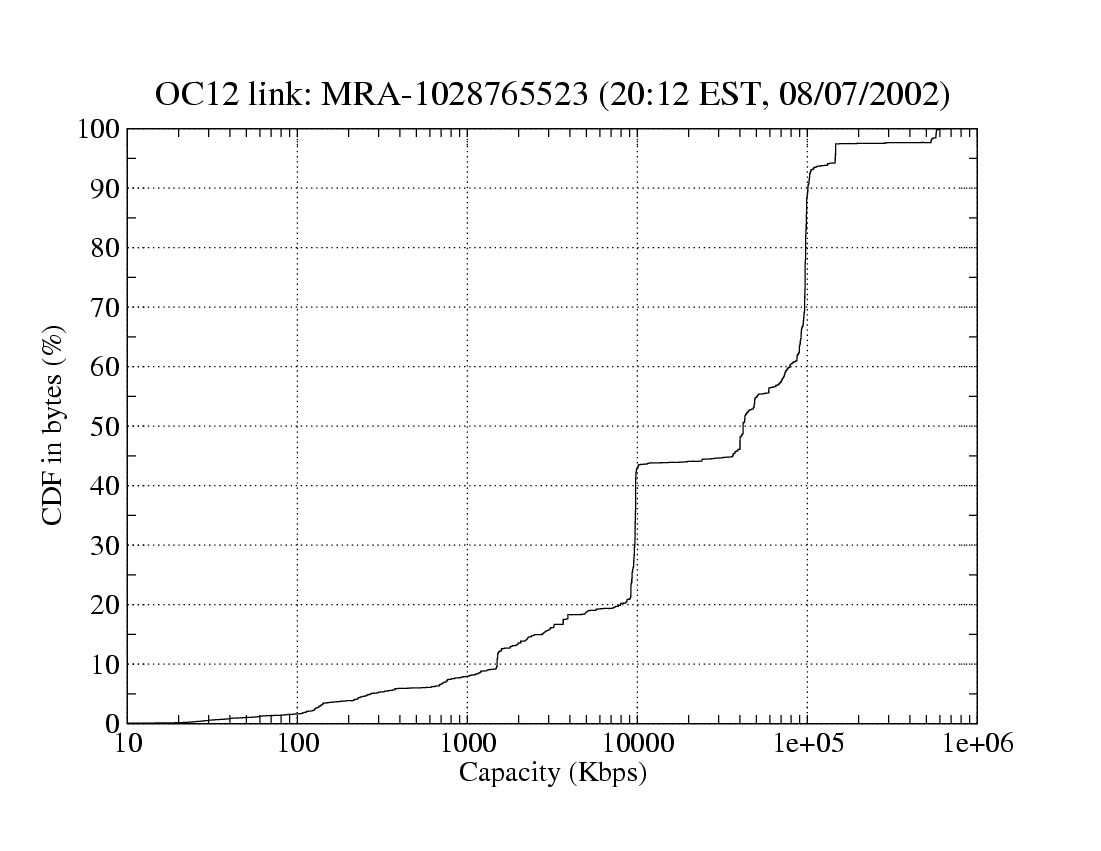
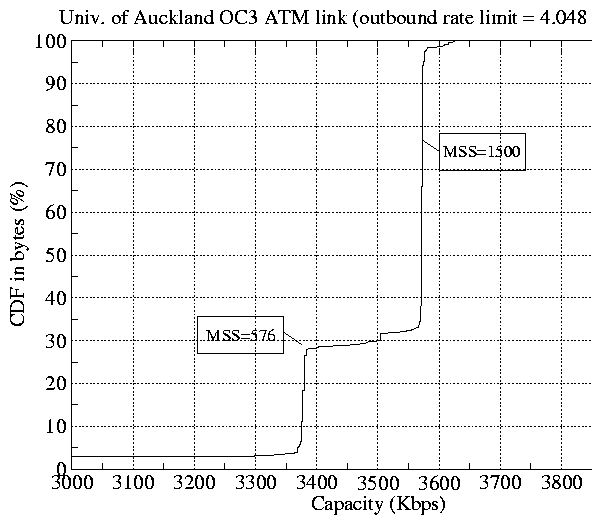
Figure 9: Capacity distribution in terms of bytes at two links. (Data sources: NLANR PMA Project[18][19])
Figure 9 shows the distribution of capacity estimates in two traces. Note that the CDF is plotted in terms of TCP bytes, rather than TCP flows. In the left graph, we see four dominant capacities at 1.5Mbps, 10Mbps, 40Mbps, and 100Mbps. These values correspond to the following common link bandwidths: T1, Ethernet, T3, and Fast Ethernet. The right graph shows the capacity distribution for the outbound direction of the ATM OC-3 link at University of Auckland, New Zealand. This link is rate-limited to 4.048Mbps at layer-2. However, we observe two modes at layer-3 (at 3.38Mbps and 3.58Mbps .) The former mode corresponds to 576B IP packets, while the latter mode corresponds to 1500B IP packets. The difference is due to the overhead of AAL5 encapsulation, which depends on the IP packet size.
We plan to submit a paper describing this methodology to the PAM 2004 conference.
8 New results and publications in bandwidth estimation
Our available bandwidth estimation methodology, called Self-Loading Periodic Streams (SLoPS) , was published in last year's ACM SIGCOMM conference [ 20 ]. That paper, entitled ``End-to-End Available Bandwidth: Measurement methodology, Dynamics, and Relation with TCP Throughput'', has been recently selected as one of the best papers of the SIGCOMM 2002 proceedings, and it will appear in the August 2003 issue of the IEEE/ACM Transactions in Networking. The journal version of the paper includes a new sensitivity analysis of some key parameters used in the SLoPS methodology. We note that the Transactions in Networking is the premier journal for computer networks research.In a different work, we showed that some bandwidth estimation tools, specifically Pathchar , Pchar , and clink , give erroneous results when the measured paths include layer-2 store-and-forward switches. Since many paths and modern routers in campus and enterprise networks contain such layer-2 devices, these bandwidth estimation tools should be avoided. Their results may be consistently and significantly different than the true capacity of the measured paths. These results have been published at the IEEE INFOCOM 2003 conference [ 4 ].
Experiments running Pathchar , Pchar , and clink against known cross-traffic loads on CAIDA's simulation testbed confirm the inaccuracy of these tools. No further testing of these tools will occur.
9 Bandwidth estimation survey
Over the last few years there has been significant progress in the area of bandwidth estimation. More than a dozen software tools claim to measure different bandwidth metrics and use different methodologies. Also, several papers in the research literature discuss capacity and available bandwidth estimation methodologies.Differences in terminology often obscure what methodology is suitable for measuring which bandwidth metric. While all bandwidth estimation tools attempt to identify ``bottlenecks'' it is not always clear how to map this vague notion of bandwidth to specific performance metrics. In fact, in some cases it is not clear whether a particular methodology actually measures the bandwidth metric it claims to measure. Additionally, tools employing similar methodologies may yield significantly different results.
We have recently written a survey paper, entitled ``Bandwidth estimation: metrics, measurement techniques, and tools'' which describes the key developments in this area over the last few years. The paper presents a taxonomy of the currently available tools and compares their main differences and similarities. The paper has been accepted for publication at the IEEE Network magazine [ 3 ]. Our survey clarifies which metric each bandwidth measurement methodology estimates and presents a taxonomy of the major publicly-available bandwidth measurement tools, including pathchar , pchar , pipechar , nettimer , pathrate , and pathload , commenting on their unique characteristics. We include here Table 1 from that paper giving the names of the currently available bandwidth estimation tools together with the target bandwidth metric they try to estimate and the basic methodology that they use.
| Tool | Author | Measurement metric | Methodology |
| pathchar | Jacobson | Per-hop Capacity | Variable Packet Size |
| clink | Downey | Per-hop Capacity | Variable Packet Size |
| pchar | Mah | Per-hop Capacity | Variable Packet Size |
| bprobe | Carter | End-to-End Capacity | Packet Pairs |
| nettimer | Lai | End-to-End Capacity | Packet Pairs |
| pathrate | Dovrolis-Prasad | End-to-End Capacity | Packet Pairs & Trains |
| sprobe | Saroiu | End-to-End Capacity | Packet Pairs |
| cprobe | Carter | End-to-End Available-bw | Packet Trains |
| pathload | Jain-Dovrolis | End-to-End Available-bw | Self-Loading Periodic Streams |
| IGI | Hu | End-to-End Available-bw | Self-Loading Periodic Streams |
| pathChirp | Ribeiro | End-to-End Available-bw | Self-Loading Packet Chirps |
| netest2 | Guojun | End-to-ENd Available-bw | Not known |
| treno | Mathis | Bulk Transfer Capacity | Emulated TCP throughput |
| cap | Allman | Bulk Transfer Capacity | Standardized TCP throughput |
| ttcp | Muuss | Achievable TCP throughput | TCP connection |
| Iperf | NLANR | Achievable TCP throughput | Parallel TCP connections |
| Netperf | NLANR | Achievable TCP throughput | Parallel TCP connections |
| netest2 | Guojun | Maximum TCP throughput | TCP connection |
F
UTURE
C
HALLENGES
-
Bandwidth estimation in the 1-10Gbps range:
The gradual deployment of 10GigEthernet and OC-192 technologies opens the way for paths with an end-to-end bandwidth of up to 10Gbps. We are going to test our bandwidth estimation tools, Pathrate and Pathload, in such paths during the fall of 2003. The measurement of bandwidth in such high-capacity paths presents unique challenges, mostly due to the limited clock resolution at the end-hosts. The technique that we have developed for dealing with interrupt coalescence in GigEthernet paths is expected to also work in 10GigEthernet paths even though longer packet trains may be needed.
Now that we can generate reasonably realistic cross-traffic, we need to add more experimental conditions to our testlab methodology, especially those containing multiple different capacity hops. We would also like to add new tools to the suite of tools undergoing evaluation (e.g., Jiri Navratil's ABwe tool). Correlation of previous and planned test results to specific test conditions is likely to inform future bandwidth estimation algorithm development.
- Predictability and variability of available bandwidth: The available bandwidth is a dynamically varying metric. As different connections come and go, available bandwidth can vary significantly along a wide range of timescales. Measurement of available bandwidth will be of limited use if dynamic variations are significant and unpredictable. For this reason we are pursuing a deeper investigation of the predictability of the available bandwidth in Internet traffic. Our goal is to examine whether available bandwidth is predictable in timescales that extend between 10-100 seconds, which are the timescales of interest for many important applications.
- Parallel TCP connections and bandwidth estimation: Parallel TCP streams are often used, especially in the transfer of huge scientific data sets, to improve the aggregate throughput delivered to applications. An important use of bandwidth estimation is to determine the appropriate number and socket buffer size of the parallel TCP streams that such applications should initiate. Too many parallel streams add significant overhead to end-hosts and applications, It these parallel streams compete with each other in the network this leads to sub-optimal throughput. Too few parallel streams, on the other hand, may be insufficient to saturate a network path especially in the presence of random packet losses.
- Use of bandwidth estimation in TCP slow start: Our experiments show that TCP throughput suffers in high Bandwidth-Delay Product networks. A major reason for this problem is that TCP experiences massive packet losses and successive timeouts at the end of the slow start phase. This occurs because TCP increases its send window multiplicatively during that phase. This problem can be avoided through bandwidth estimation. An initial bandwidth estimate can be used to set the ssthresh TCP variable, limiting the slow start phase before it causes massive losses. We are currently working on different techniques to integrate such a bandwidth estimation technique into the TCP code.
R
ESEARCH
I
NTERACTIONS
[1] - I NTERACTIONSWITHOTHER DOE NETWORKRESEARCHPROJECTS
Over the last two years, our group has collaborated with several other DOE researchers. The main DOE-funded researchers that we often interact with include Les Cottrell (SLAC), Tom Dunigan and Nagi Rao (ORNL), Brian Tierney, Deb Agarwal, and Jin Guojun (LBNL), Wu-chen Feng and Mark Gardner (LANL), Matt Mathis (PSC), and Karsten Schwan (GATech).
These collaborations include discussions at conferences, workshops, and technical meetings, testing of bandwidth estimation tools, sharing of simulation code, sending/receiving comments on research papers, etc. More recently, we received a joint NSF grant with Nagi Rao of ORNL and Karsten Schwan of GAtech. This grant will further strengthen the links between our research program and DOE funded networking research at national labs.
In addition, kc claffy co-authored a slideset with Les Cottrell and Brian Tierney (with feedback from NLANR's Hans-Werner Braun) that was presented at the Large Scale Network meeting on June 10, 2003 at the National Science Foundation. This talk, entitled ``priorities and challenges in Internet measurement simulation and analysis" is available on the web at:
http://www.caida.org/publications/presentations/2003/lsn20030610/.
[2] - I NTERACTIONSWITH DOE APPLICATIONCOMMUNITIES
Our main interaction with the application community comes through the Web. Specifically, our bandwidth estimation tools are accessible at http://www.pathrate.org . Since the latest release on April 10, 2003 until today there were 2000 hits on that web page. The logs of the tool downloads shows that our users come from a wide variety of Internet domains (mostly .edu, .net, and .com), and from all over the world.
Together with our two bandwidth estimation tools, many users are also familiar with our work through research papers. Publishing papers at major conferences brings visibility to this project, and to the entire SciDAC program, and convinces users that these measurement tools are based on solid estimation techniques, rather than on questionable heuristics.
Finally, we were present at the SciDAC booth of the SuperComputing 2002 conference, demonstrating the tools and their underlying measurement methodologies.
References
- [1]
- N. Brownlee, ``Using netramet for production traffic measurement,'' in IEEE Integrated Management Strategies for the New Millenium, Seattle, WA , May 2001.
- [2]
- A. Broido, R. King, E. Nemeth, and k claffy, ``Radon spectroscopy of inter-packet delay,'' in Proceedings of the High-Speed Networking (HSN) Workshop , June 2003.
- [3]
- R. S. Prasad, M. Murray, C. Dovrolis, and K. Claffy, ``Bandwidth Estimation: Metrics, Measurement Techniques, and Tools,'' IEEE Network , 2003. to appear.
- [4]
- R. S. Prasad, C. Dovrolis, and B. A. Mah, ``The Effect of Layer-2 Store-and-Forward Devices on Per-Hop Capacity Estimation,'' in Proceedings of IEEE INFOCOM , 2003.
- [5]
- R. S. Prasad, C. Dovrolis, and B. A. Mah, ``The Effect of Layer-2 Switches on Pathchar-like Tools,'' in Proceedings Internet Measurement Workshop (IMW) (short abstract) , 2002.
- [6]
- V. Paxson and S.Floyd, ``Wide Area Traffic: The Failure of Poisson Modeling,'' IEEE/ACM Transactions on Networking , vol. 3, pp. 226-244, June 1995.
- [7]
- A. Broido, k claffy, and E. Nemeth, ``Packet arrivals on rate-limited Internet links.'' http://www.caida.org/ broido/coral/packarr.html, Nov. 2000.
- [8]
- W. Cleveland and D. Sun, ``Internet Traffic Data,'' in Statistics in the 21st Century , Chapman & Hall LRC, NY, 2002.
- [9]
- J. Micheel, ``NLANR PMA Datacube.'' http://pma.nlanr.net/PMA/Datacube.html, May 2001.
- [10]
- A. Broido, E. Nemeth, and k claffy, ``Spectroscopy of DNS Update Traffic,'' in Proceedings of ACM SIGMETRICS , June 2003.
- [11]
- S. Shalunov and B. Teitelbaum, Bulk TCP Use and Performance on Internet2 , 2002. Also see: http://netflow.internet2.edu/weekly/.
- [12]
- B. Tierney, ``TCP Tuning Guide for Distributed Applications on Wide Area Networks,'' USENIX & SAGE Login , Feb. 2001.
- [13]
- W. Mathews and L. Cottrell, ``The PingER project: Active internet performance monitoring for the HENP community,'' IEEE Communications , vol. 38, pp. 130-136, May 2000.
- [14]
- S. Kalidindi and M. Zekauskas, ``Surveyor: An infrastructure for internet performance measurements,'' in Proc. INET'99 , 1999.
- [15]
- R. Wolski, N. Spring, and C. Peterson, ``Implementing a performance forecasting system for metacomputing: the network weather service,'' in Proc. of Supercomputing , 1997.
- [16]
- A. Danalis and C. Dovrolis, ``ANEMOS: An Autonomous Network Monitoring System,'' in Proceedings of Passive and Active Measurements (PAM) Workshop , 2003.
- [17]
- C. Dovrolis, P. Ramanathan, and D. Moore, ``What do Packet Dispersion Techniques Measure?,'' in Proceedings of IEEE INFOCOM , pp. 905-914, Apr. 2001.
- [18]
- NLANR Passive Measurement and Analysis Project (PMA), "University of Auckland OC3 trace." http://pma.nlanr.net/Traces/Traces/long/auck/6/20010611-120000-1.gz, June 2001. Sponsored by the National Laboratory for Applied Network Research and the National Science Foundation (NSF) Cooperative Agreement Nos. ANI-0129677 (2002) and ANI-9807479 (1997).
- [19]
- NLANR Passive Measurement and Analysis Project (PMA), "Abilene OC12 trace." http://pma.nlanr.net/Traces/Traces/daily/20020808/, Aug. 2002. Sponsored by the National Laboratory for Applied Network Research and the National Science Foundation (NSF) Cooperative Agreement nos. ANI-0129677 (2002) and ANI-9807479 (1997).
- [20]
- M. Jain and C. Dovrolis, ``End-to-End Available Bandwidth: Measurement Methodology, Dynamics, and Relation with TCP Throughput,'' in Proceedings of ACM SIGCOMM , pp. 295-308, Aug. 2002.
A
PPENDIX
- P
ROJECT
P
UBLICATIONS
Note:
All publications are available at http://www.cc.gatech.edu/ dovrolis/
- M. Jain and C. Dovrolis, ``End-to-end available bandwidth: measurement methodology, dynamics, and relation with TCP throughput,'' (journal version) to appear in IEEE/ACM Transactions in Networking, August 2003 issue.
- C. Dovrolis, P. Ramanathan, and D. Moore, ``Packet Dispersion Techniques and Capacity Estimation,'' submitted for publication at IEEE/ACM Transactions in Networking, April 2003.
- R. S. Prasad, M. Murray, C. Dovrolis, K. C. Claffy, ``Bandwidth estimation: metrics, measurement techniques, and tools,'' to appear in IEEE Network Magazine, accepted in April 2003.
- M. Jain, R. S. Prasad, C. Dovrolis, ``Socket Buffer Auto-Sizing for Maximum TCP Throughput,'' submitted for publication at IEEE International Conference on Network Protocols (ICNP) , May 2003.
- A. Danalis, C. Dovrolis, ``ANEMOS: Autonomous NEtwork Monitoring System,'' in Proceedings of the 4th Passive and Active Measurements workshop, April 2003.
- R. S. Prasad, C. Dovrolis, B. A. Mah, ``The Effect of Layer-2 Store-and-Forward Devices on Per-Hop Capacity Estimation,'' in Proceedings of the 2003 INFOCOM conference, April 2003.
- R.S. Prasad, C. Dovrolis, and B.A. Mah, ``The Effect of Layer-2 Store-and-Forward Devices on Pathchar-like Tools,'' in Proceedings of ACM Internet Measurement Workshop (IMW), (extended abstract) November 2002.
- M. Jain and C. Dovrolis, ``End-to-end available bandwidth: measurement methodology, dynamics, and relation with TCP throughput,'' in Proceedings of ACM SIGCOMM, August 2002.
- M. Jain and C. Dovrolis, ``Pathload: A measurement tool for end-to-end available bandwidth,'' in Proceedings of Passive and Active Measurements (PAM) Workshop, March 2002.
- C. Dovrolis, P. Ramanathan, and D. Moore, ``What do Packet Dispersion Techniques Measure?,'' in Proceedings of IEEE INFOCOM, April 2001.
File translated from T
E
X by
T
T
H
, version 2.92.
On 13 Jun 2003, 15:24.