![[CAIDA - Center for Applied Internet Data Analysis logo]](/images/caida_globe_faded.png "Go to CAIDA home page")
Creating a Bandwidth Estimation Testbed
Summer 2001 Status Report
Stefano Masini stefano@cs.utexas.edu ste@caida.org, Margaret Murray margaret@caida.org
Contents
1 Introduction: Problem to be Solved1.1 Currently Available Bandwidth Estimation Tools
1.2 Types of Bandwidth Estimation Tools
1.2.1 Rationale for Testing Sender Based Tools
1.2.2 Rationale for Testing Sender-Receiver Based Tools
1.2.3 Analysis
1.3 Storing Results: a Database Approach
1.4 Draft Database Design
1.5 Database Entities
1.5.1 Interfacing with the Database: links.pl
2 Bandwidth Estimation Testbed Control Infrastructure
2.1 Central Job Control Machine
2.2 Individual Testbed Host Operation
2.3 Job Control Toolset
2.4 Using the Testbed
3 Results to Date
3.1 Bandwidth Estimation Tools Installed
3.2 Physical Topology Data Collection
4 Next Steps
4.1 Refine Database
4.2 Collect Data for all Tools
4.3 Analyze Data
4.4 Maintain Physical Topology Data
4.5 Stefano's Work Plan
5 Appendix A: Database SQL structure
1 Introduction: Problem to be Solved
Accurate bandwidth estimation algorithms and tools can benefit a large class of data-intensive and distributed scientific applications. However, existing tools and methodologies for measuring network bandwidth metrics, (such as capacity, available bandwidth, and throughput) are mostly ineffective across real Internet infrastructures.
The Internet research and bandwidth estimation tool development communities could benefit from research into comparing and contrasting the performance of different bandwidth estimation tools. Comparisons of what these tools actually measure (metrics), as well as the algorithms used in their measurement methodology could be used to identify ways to improve both the accuracy and relevance of these tools.
This report describes progress to date in CAIDA's efforts to create an experimental testbed that can provide a common platform for comparing performance of different bandwidth estimation tools. Building upon already deployed skitter active measurement infrastructure (For more information, see http://www.caida.org/tools/measurement/skitter), this testbed exists within a logical topology that is fairly representative of the global Internet. Furthermore, CAIDA already manages or works with managers of the testbed machines. While CAIDA does not manage the physical links connecting those machines, it is in a position to solicit specific information about underlying link characteristics from the ISPs who do control those links.
1.1 Currently Available Bandwidth Estimation Tools
Table 1 shows the bandwidth estimation tools that are publicly available. The top portion lists those that are currently under test. For these tools, results are being collected, but haven't yet been analyzed. The bottom portion of the table lists those tools for which testing is planned.
| Tool | Source/Author | Under test |
| pathchar | Van Jacobson (first tool) | Yes |
| pathrate | Constantinos Dovrolis, U. Delaware | Yes |
| pipechar | LBL, Berkeley Labs | Yes |
| pchar | Bruce Mah, Cisco | Yes |
| bprobe, cprobe | Oceans group, Boston U. | Yes |
| nettest | Lawrence Berkeley Lab | No |
| nettimer | Kevin Lai, Stanford | No |
| bing | not maintained | No |
| clink | Downey, Wellesley College | No |
| netperf | HP | No |
| treno | Pittsburg Supercomputer Center | No |
| ttcp | Army Research Lab | No |
| nttcp | Technische U. Munchen | No |
| sprobe | U. Washington | No |
1.2 Types of Bandwidth Estimation Tools
Bandwidth estimation tools are of two primary types:-
Sender Based tools require access require access to a machine at only one end of the path being tested. These tools will be tested on the 20-node testbed described in Table 2.
Machine Location Note spycam.caida.org San Diego chenin.caida.org Boulder, CO wayback.uoregon.edu Eugene, OR amaranth.cs.utexas.edu Austin, TX ste UT desktop pinot.students.cs.unibo.it Bologna, IT ste's IT workstation e-root.skitter.caida.org Moffett Field, CA f-root.skitter.caida.org Palo Alto, CA k-root.skitter.caida.org London, UK yto.skitter.caida.org Ottawa, Canada l-root.skitter.caida.org Marina del Rey, CA m-root.skitter.caida.org Tokyo, JP sjc.skitter.caida.org San Jose, CA k-peer.skitter.caida.org Amsterdam, NL mw.skitter.caida.org San Jose, CA lhr.skitter.caida.org London, UK apan-jp.skitter.caida.org Tokyo, JP waikato.skitter.caida.org Hamilton, NZ a-root.skitter.caida.org Herndon, VA nrt.skitter.caida.org Tokyo, JP skitter.uoregon.edu Eugene, OR Table 2: Machines for Testing Sender Type Tools. -
Sender-Receiver Based tools require access to machines at both ends of the path. These tools will be tested using the 5-node testbed described in Table 3.
Machine Location Note spycam.caida.org San Diego, CA ste's caida desktop chenin.caida.org Boulder, CO wayback.uoregon.edu Eugene, OR amaranth.cs.utexas.edu Austin, TX ste's utexas desktop pinot.students.cs.unibo.it Bologna, Italy ste's home university workstation Table 3: Machines for Testing Sender-Receiver Type Tools.
1.2.1 Rationale for Testing Sender Based Tools
Sender based tools will be tested on the 20-node testbed listed in Table 2. Specific strategies for testing these tools have not yet been developed.
1.2.2 Rationale for Testing Sender-Receiver Based Tools
Sender-Receiver type tools require access to both the source and destination of each path. Sender-Receiver based tools will be tested on the 5-node testbed listed in Table 3.
Testing is comprised of global and local runs. A global run is composed of a complete set of local runs, exactly one for each distinct source-destination pair. A local run is one single execution of the tool on an individual source-destination pair. The state of a global run indicates which destination hosts have been tested from this source so far, and which ones still need to be tested.
Tests are run as follows: runPathrate.pl starts on a source host by parsing its global run state, which is a list of all of its destination hosts, each indicating whether its local run has completed. runPathrate.pl cycles though the list to find the next host showing not yet complete. and a local run is launched for that destination. Upon completion, runPathrate.pl updates the global run state, and again finds the next host on which to launch a local run. Whenever a global run completes, a new global run is initiated.
The 5 machines in this testbed have 20 distinct source and destination path pairs. However, because underlying WAN routing changes frequently, many more than 20 physical links may occur on these paths.1 Therefore, historical information about changes in the underlying physical links will be gathered for correlation with bandwidth test estimation results.
In order to track changes in paths, each testbed host probes every other testbed host once every 3 minutes, using traceroute. To facilitate synchronization and minimize traffic load, a script trace.pl manages both this probing as well as tool operation for the entire testbed. Tools are tested in a continuous manner and their output is stored on the file system of the Sender host for later collection into a centralized analysis server.
1.2.3 Analysis
Analysis involves:- Parsing test output to extract data measurements, and
- Interpreting measurements by comparing them to information about the real physical topology.
1.3 Storing Results: a Database Approach
Several reasons suggest the use of a database to manage bandwidth tool testbed data:
- Analysis requires access to historical information about the underlying physical topology.
- Continuously collected time-series data needs to be sorted according to a variety of not yet completely specified criteria.
Using a database enables consistent data storage, yet it is also possible to refine data schema organization in response to evolving criteria.
The database also facilitates timestamping information when it is collected, while also indicating for what time period it is valid. For example: Consider the case where an ISP sends information on 3-Mar-2002 noting that a particular physical link was upgraded on 28-Feb-2002, and that another upgrade will be made on 5-Aug-2002. In this case, the information receipt is 3-Mar-2002, and its valid time period is from 28-Feb-2002 through 5-Aug-2002.
This project initially utilizes the mySQL relational database. Therefore, data is stored in tables organized according to an Entity/Relationship (E/R) data structure or schema. Measurements made by bandwidth estimation tools are stored separately (in different tables) from information provided by ISPs.
There is one case where assumptions must be made about data from traceroute probes. traceroute provides a list of component hop IP addresses, but does not provide any information about the underlying routers and their interface configurations. When links not already in the database are probed, new nodes and interfaces must be created. Consecutive addresses A and B returned by traceroute are assumed to belong to two distinct nodes. However, there is no way to know how many interfaces exist at either node. If Node A has only one interface and Node B has two interfaces, the other interface at Node B that is not traversed by traceroute will be hidden.2
This known error does not preclude the database from being useful for the purpose of evaluating bandwidth estimation tools. However, a different level of confidence must be given.
1.4 Draft Database Design
The database organizes:
- Measurements collected by bandwidth estimation tools.
- traceroute probe data.
- Information about physical links.
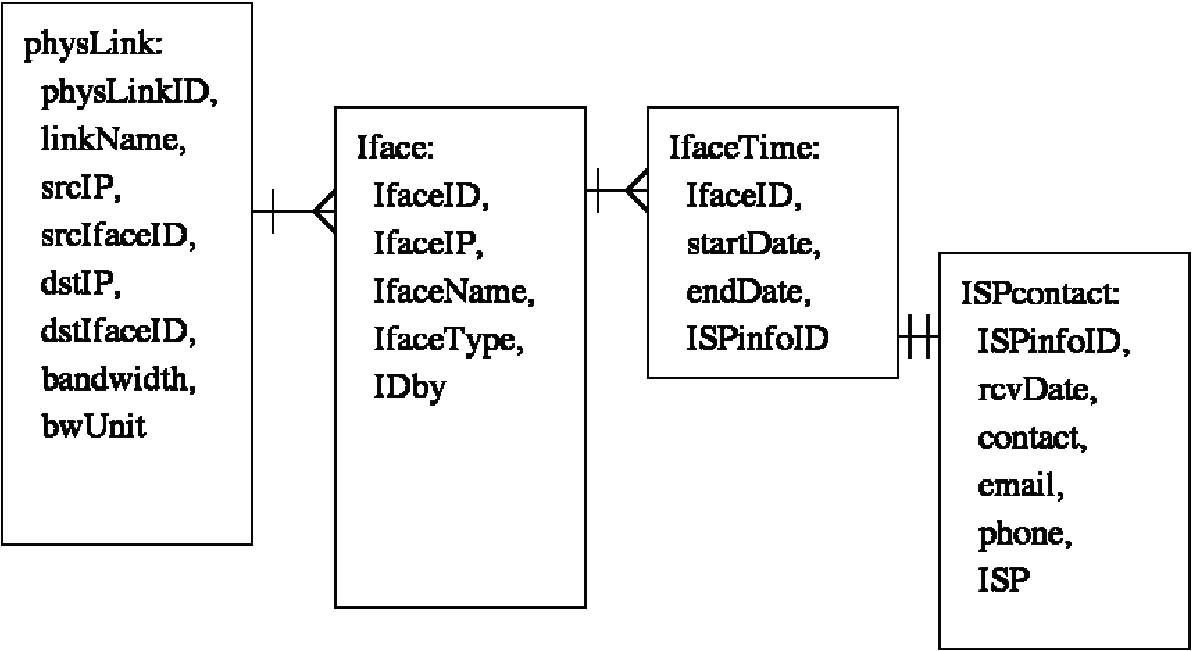
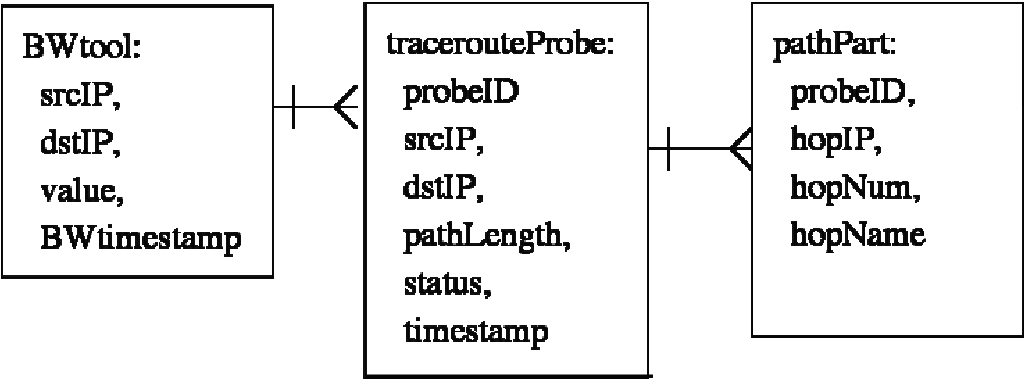
A conceptual design of the database is shown in Figures 1, 2, and 3. In these figures, boxes represent mySQL tables, while lines and arrows represent relationships between tables. For a 1tomany relationship, a single bar indicates the '1' side while the 'crow's foot' shows the many side. Appendix A shows the complete SQL code to generate the database.
|
|
|
|
|
|
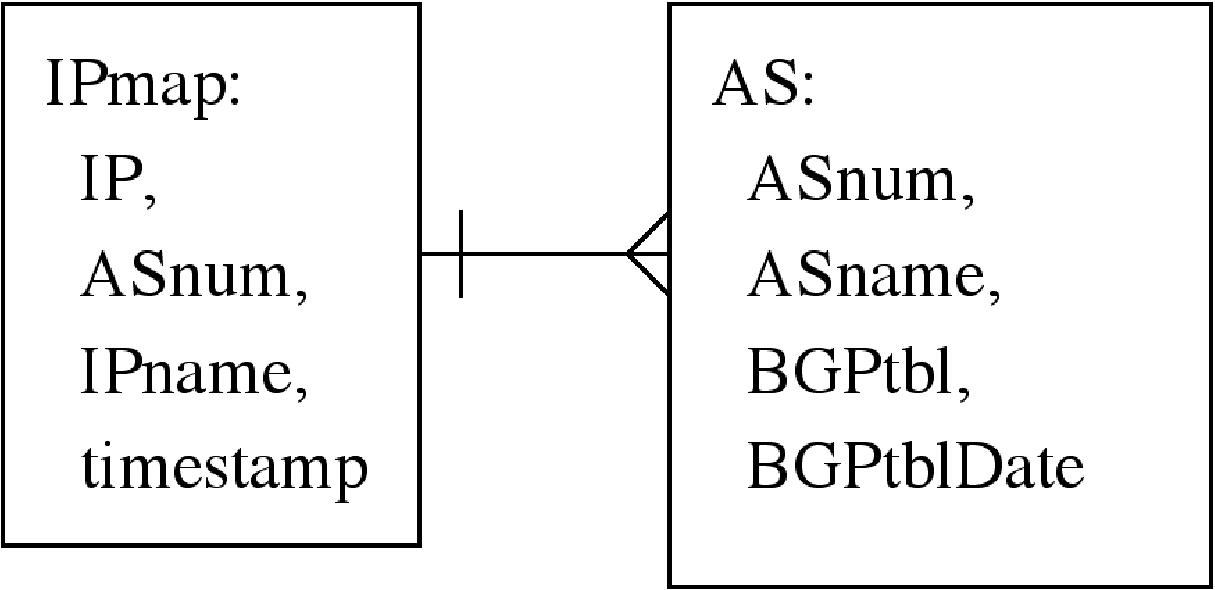
1.5 Database Entities
Relevant topology data is stored in database entities. Entities include:
-
Physical Link Description. Physical links are uniquely identifiable by combining source and destination IP addresses with their respective source and destination Network Interface Descriptions.
Interesting cases include:
- Load balancing: where one IP address corresponds to many Network Interfaces
- IP aliasing: where many IP addresses correspond to only one Network Interface
- Network Interface Description. Interface data may be acquired from ISP contacts, or by using either the iffinder tool,3 ori (with less accuracy) results of traceroute probes.
- Bandwidth Estimation Tool Measurements. Contains timestamped measurements taken on specific testbed links.
- tracerouteProbe Results. Timestamped probe results are used to correlate path bandwidth measurements to the component physical links of the underlying topology.
1.5.1 Interfacing with the Database: links.pl
While mySQL commands may be used to access to database tables, links.pl is Perl frontend encapsulating more project specific database functions. These Perl commands may be issued either from the Unix command line or via a stored script.
Required links.pl commands:
- %ShowLink Given a source IP address, a destination IP address, and a specific time interval, return all information describing the associated component physical links.
- %addLinkInfo Insert information about a new physical link.
- %findProbes Given a source IP address, a destination IP address, and a specific time interval, return results of all relevant traceroute probes.
- %updateDB Append or correct information about physical links.
2 Bandwidth Estimation Testbed Control Infrastructure
A simple and controllable method for starting jobs at the testbed hosts is required. While ssh is sufficient for some things, several difficulties need to be addressed:
- ssh works differently on different operating systems.
- ssh requires a password, but the Testbed Job Control system needs to be run by program scripts requiring no user intervention. The only way around this would create a significant security vulnerability.
- ssh can be slow. On chenin: the protocol handshake can take up to 3 seconds.
2.1 Central Job Control Machine
A central job control machine collects the data from the various testbed hosts. rsync4 is used to synchronize data collection. In addition, rsync manages distribution of testbed code.
Each testbed host contains the following filesystem directories and sub-directories whose contents are periodically fetched back to the central job control machine using rsync:
- The testbed sub-directory is present in the home directory of the test operator on each machine.
- testbed/common contains the scripts that implement the control service. Scripts are developed and maintained on the central job control machine and propagated to the testbed using rsync.
- testbed/local contains the test data produced by each individual testbed host.
- testbed/server contains host-specific information,
- testbed/local contains all data collected by the testbed host.
2.2 Individual Testbed Host Operation
Each machine in the testbed runs Perl server server.pl, to do the following:
- Encrypt Client Data. Data is XORed with a shared private key (i.e. a long cryptic string hardcoded in the Perl source). As long as hackers can not access this source code, this simple level of security should be sufficient for our purposes.
- Perform Job Control. Start and monitor processes. Jobs and all of their spawned children can also be killed if necessary. Job information stored on disk can be used to restart processes in the event of a crash.
- Log Job Progress. Job output is logged to a file named at job startup.
- Handle Time-outs. If tools fail, they time-out to prevent the system from hanging.
2.3 Job Control Toolset
The testbed/common directory on testbed hosts as well as the local rsync mirror on the central job control machine contains the following Perl tools:
- server.pl Implements overall testbed control.
- client.pl Makes connections to all the other testbed hosts for probing.
- CrDecr.pm Perl library that supports the simple encryption scheme used by both server.pl and client.pl.
- start_server.sh Shell script that runs the server, logs its output (for debugging purposes) and restarts it in case of a system crash.
-
keepRunning.pl This simple Perl wrapper for generic commands has the following capabilities:
- Capture the output of the tool (both stdout and stderr) to a specified file. Output is reduced to a single line by substituting carriage returns with a special string. In addition,
- Prepend a timestamp to any command line output. This makes it possible to distinguish different runs of the command upon later analysis.
- Time-out any command if necessary. (granularity=minutes)
- Control command execution (once, many times or an infinite number of times with a specified delay interval between executions).
- show_keepRunning.pl Perl script used to view the output of the keepRunning.pl output.
- trace.pl This Perl wrapper around traceroute stores results in the same format as skitter ASCII data.5
- runPathrate.pl This Perl script tests the pathrate tool. Eventually this script will be generalized to run every sender-receiver based bandwidth estimation tool.
2.4 Using the Testbed
client.pl implements the following commands:
- ps is the normal Unix command.
- kill the Unix command used to kill a process.
- jobs shows the jobs currently running on the host.
- killjob is used to kill a job.
- killalljobs kills all the running jobs.
- exec executes a command by using keepRunning.pl.
- terminate terminates the server. It is used when upgrading the server code: the new release is first propagated via rsync, then every server is terminated with terminate. Finally the start_server.sh script will take care of automatically restarting the new version, so that the changes take effect.
3 Results to Date
3.1 Bandwidth Estimation Tools Installed
pathrate has been installed on five testbed hosts.
3.2 Physical Topology Data Collection
Information supplied by 18 ISP contacts has been input into the database.
4 Next Steps
4.1 Refine Database
Significant testing and refinements of the database is planned.
4.2 Collect Data for all Tools
Data collection for additional tools is planned.
4.3 Analyze Data
The output of different bandwidth estimation tools must be parsed, and resulted compared and interpreted.4.4 Maintain Physical Topology Data
Current knowledge about the physical topology is not complete, and information provided by ISPs needs to be maintained.
4.5 Stefano's Work Plan
While I plan to continue work on this project, I will not be able to work on it full time, due to responsibilities of classes and other projects. I will try to get some results by January.
I will start collecting data for all the rest of the tools. I also need to parse tool outputs and generalize the runPathrate.pl script.
I also need to develop a report for presenting physical link information stored in the database.
5 Appendix A: Database SQL structure
The following SQL code was obtained with the command mysqldump.
# MySQL dump 8.14
#
# Host: localhost    Database: BWtestbed
#--------------------------------------------------------
# Server version    3.23.38

#
# Table structure for table 'AS'
#

CREATE TABLE ASinfo (
  ASnum int(10) unsigned NOT NULL default '0',
  ASname varchar(32) default NULL,
  BGPtbl varchar(64) default NULL,
  BGPtblDate datetime NOT NULL default '0000-00-00 00:00:00'
) TYPE=MyISAM;


#
# Table structure for table 'BWtool'
#

CREATE TABLE BWtool (
  srcIP int(10) unsigned NOT NULL default '0',
  dstIP int(10) unsigned NOT NULL default '0',
  value float(16,4) default NULL,
  BWtimestamp datetime NOT NULL default '0000-00-00 00:00:00'
) TYPE=MyISAM;

#
# Table structure for table 'IPmap'
#

CREATE TABLE IPmap (
  IP int(10) unsigned NOT NULL default '0',
  ASnum int(10) unsigned NOT NULL default '0',
  IPname varchar(64) default NULL,
  timestamp datetime NOT NULL default '0000-00-00 00:00:00'
) TYPE=MyISAM;


#
# Table structure for table 'ISPcontact'
#

CREATE TABLE ISPcontact (
  ISPinfoID int(8) NOT NULL default '0',
  rcvDate datetime default NULL,
  contact varchar(64) default NULL,
  email varchar(64) default NULL,
  phone varchar(64) default NULL,
  ISP varchar(32) default NULL
) TYPE=MyISAM;


#
# Table structure for table 'Iface'
#

CREATE TABLE Iface (
  ifaceID int(8) NOT NULL default '0',
  IfaceIP int(10) unsigned NOT NULL default '0',
  IfaceName varchar(64) default NULL,
  IfaceType varchar(16) default NULL,
  IDby varchar(16) default NULL
) TYPE=MyISAM;


#
# Table structure for table 'IfaceTime'
#

CREATE TABLE IfaceTime (
  IfaceID int(8) NOT NULL default '0',
  startDate datetime default NULL,
  endDate datetime default NULL,
  ISPinfoID int(8) default NULL
) TYPE=MyISAM;


#
# Table structure for table 'pathPart'
#

CREATE TABLE pathPart (
  probeID int(8) NOT NULL default '0',
  hopIP int(10) unsigned NOT NULL default '0',
  hopNum tinyint(4) NOT NULL default '0',
  hopName varchar(64) default NULL
) TYPE=MyISAM;

#
# Table structure for table 'physLink'
#

CREATE TABLE physLink (
  physLinkID int(8) NOT NULL default '0',
  linkName varchar(16) default NULL,
  srcIP int(10) unsigned NOT NULL default '0',
  srcIfaceID int(8) default NULL,
  dstIP int(10) unsigned NOT NULL default '0',
  dstIfaceID int(8) default NULL,
  bandwidth float default NULL,
  bwUnit enum('bps','Kbps','Mbps','Gbps','Tbps') default NULL
) TYPE=MyISAM;


#
# Table structure for table 'tracerouteProbe'
#

CREATE TABLE tracerouteProbe (
  probeID int(8) NOT NULL default '0',
  srcIP int(10) unsigned NOT NULL default '0',
  dstIP int(10) unsigned NOT NULL default '0',
  pathLength tinyint(4) NOT NULL default '0',
  status enum('complete','incomplete','noreply') default NULL,
  probeTimestamp datetime NOT NULL default '0000-00-00 00:00:00'
) TYPE=MyISAM;
Footnotes:
1During the past 3 months, several hundred distinct links have been observed on the 20 path pairs.
2See the slides for an illustrated example.
3http://www.caida.org/tools/measurement/iffinder/
4See: http://samba.anu.edu.au/rsync/
5This is similar to the output of a Perl script that parses skitter data.
File translated from TEX by TTH, version 2.92.
On 11 Sep 2001, 14:35.