Internet Atlas Gallery
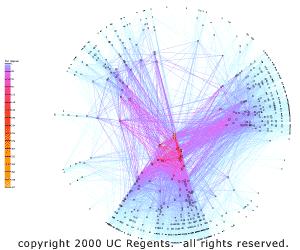
Core AS Internet
Cooperative Assocation for Data Analysis (CAIDA)
San Diego Supercomputer Center (SDSC)
University of California, San Diego (UCSD)
URL:
https://www.caida.org/research/topology/as_core_network/
Use these three demos to explore the same data used to produce the AS Core graph.
Demo 1 shows how to label Autonomous System (AS) nodes belonging
to a particular ISP. Demo 2 is similar to Demo 1 except that an AS number is given instead of
an AS or ISP name.
Demo 3 shows the AS nodes that have at least 22 outdegree
peering sessions.
| Visualization Thumbnail | Demo |
 |
To Startup Java Applet:
|
Demo 1 (Label a particular ISP):
- Choose Data File: as_core_outdegree_named.odf
- Color Value = Peering -> Outdegree
- Interaction = Select Root by Name
(e.g., SPRINT,
NIC handle) Note: must be all CAPS!
(Show list)
- View = Show Root Names
|
Demo 2 ( Find and Label AS using AS number):
- Choose Data File: as_core_outdegree_named.odf
- Color Value = Peering -> Outdegree
- Interaction = Select Root by Name
e.g., (12), (701), (6762)
Note: Enclose AS number in parentheses!
(Show list)
- View = Show Root Names
|
Demo 3 (Label Only Peers with > 22 Outdegree Peering Sessions) :
- Color Method = Mask/Color by Value
(e.g., 'Color objects where values >= 22')
|
|
| Full-Size Visualization
| Back |
Last Modified: Tue Oct-13-2020 22:21:40 UTC
Page URL: https://www.caida.org/projects/internetatlas/gallery/ascore/demo.xml

![Go to CAIDA home page [CAIDA - Center for Applied Internet Data Analysis logo]](/images/caida_globe_faded.png)