Skip to Content
[CAIDA - Center for Applied Internet Data Analysis logo]
Center for Applied Internet Data Analysis
Internet Atlas Gallery

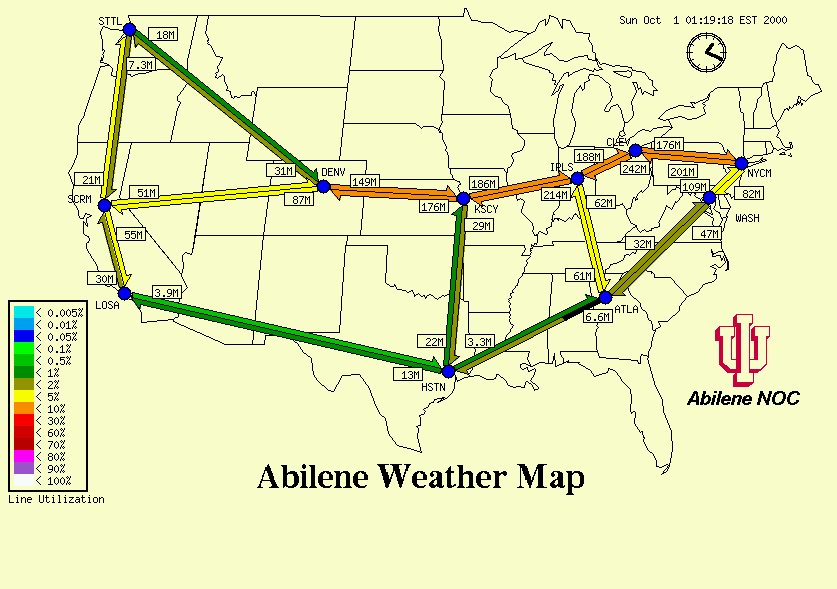
Abilene Weather Map (using MRTG data)

Mark Meiss
Indiana University Network Operations Center
Indiana University, Bloomington, IN (IU)

URL: http://hydra.uits.iu.edu/~abilene/traffic/

Visualization ThumbnailData
Data Sources:
(Source1) MRTG polls SNMP MIB of each monitored router every five minutes for line utilization and network errors on each router's attached links.
Data Specification:
(Data1) Five minute exponentially decaying sum of moving average of input and output bits per second (Data2) Percent of input and output packets in error or discarded at the router during each five-minute polling interval, multiplied by 1000.
Data Aggregation:
(Aggregate1): MRTG calculates average rate when available and normalizes these to fit in a standard five minute time slot. (Aggregate2): Error values can be calculated as an average of a specified number of historical MRTG polled values.
Data Filters:
None used.
Click Image for Full-Size Visualization Back
  Last Modified: Tue Oct-13-2020 22:21:40 UTC
  Page URL: https://www.caida.org/projects/internetatlas/gallery/mping/data.xml