Skip to Content
[CAIDA - Center for Applied Internet Data Analysis logo]
Center for Applied Internet Data Analysis
Internet Atlas Gallery

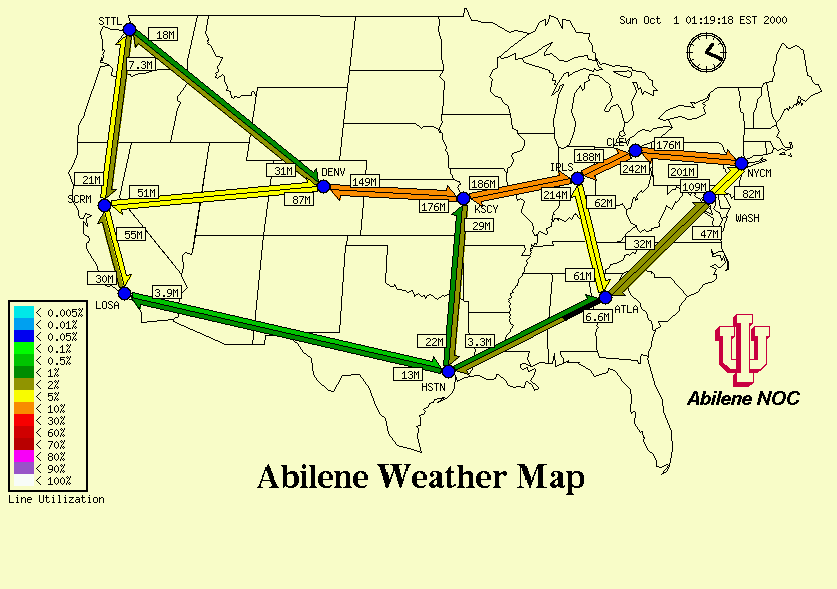
Abilene Weather Map (using MRTG data)

Mark Meiss
Indiana University Network Operations Center
Indiana University, Bloomington, IN (IU)

URL: http://hydra.uits.iu.edu/~abilene/traffic/

Visualization ThumbnailEvaluation
Strengths:
(Strength1): Color-coded, timestamped snapshots of router traffic levels give quick indication of general backbone utilization and health.
(Strength2): Hot links to underlying MRTG graphs offer glimpses of more specific trends and historical averages.
Issues:
(Issue1): Usefulness of display and statistics is limited to cursory overview.
(Issue2): Position of router at SCRM has moved to SNVA. It is not clear how changes in backbone configuration affect the utility of the traffic status animations.
Click Image for Full-Size Visualization Back
  Last Modified: Tue Oct-13-2020 22:21:40 UTC
  Page URL: https://www.caida.org/projects/internetatlas/gallery/mping/eval.xml