Skip to Content
[CAIDA - Center for Applied Internet Data Analysis logo]
Center for Applied Internet Data Analysis
Internet Atlas Gallery

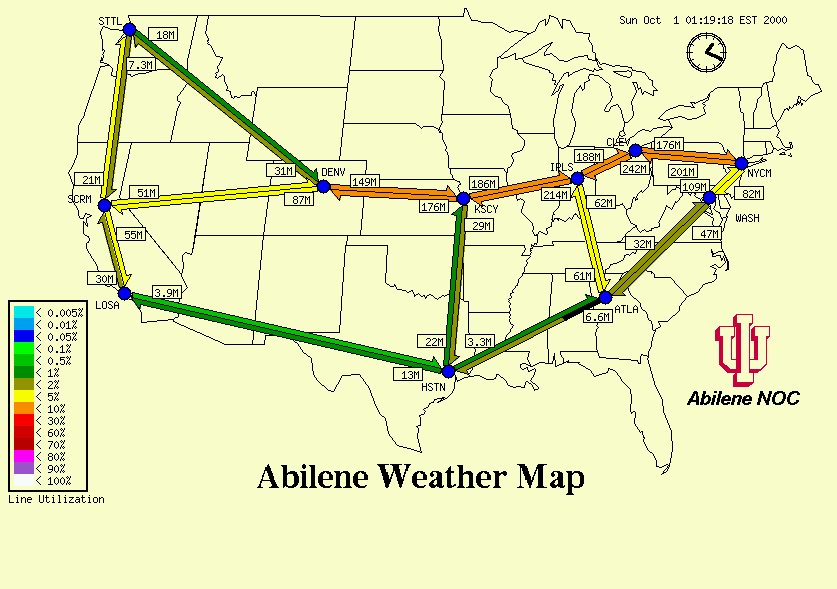
Abilene Weather Map (using MRTG data)

Mark Meiss
Indiana University Network Operations Center
Indiana University, Bloomington, IN (IU)

URL: http://hydra.uits.iu.edu/~abilene/traffic/

Visualization ThumbnailAbout the Visualization
Visualization Techniques:
(Technique1): Configuration file specifies pixel location of polygonal shapes: circle for each router, bar with half arrowhead for each link.
Key Visualization Mappings:
(Mapping1): 11 core Abilene backbone routers are displayed geographically as labeled circles:
  • STTL = Seattle, WA
  • SCRM = Sacramento, CA
  • LOSA = Los Angeles, CA
  • DENV = Denver, CO
  • KSCY = Kansas City, MO
  • HSTN = Houston, TX
  • IPLS = Indianapolis, IN
  • ATLA = Atlanta
  • WASH = Washington, D.C.
  • NYCM = New York City, NY
  • CLEV = Cleveland, OH
(Mapping2): Blue circle indicates router having active links. Gray circle indicates no active links. Circle is also a hot link to MRTG graphs.
(Mapping3): Link line utilization is colored according to the displayed key.
(Mapping4): Small box near each link indicates an absolute rate of traffic in bytes/second.
(Mapping5): Black appearing on any link bar indicates network errors, and grows logarithmically from base to tip, where the base represents 0.001 percent and the head represents 1 percent errors.
Visualization Tools:
(Tool1): Animated Traffic Map CGI scripts
(Tool2): GD Graphics library
(Tool3): MRTG - Multi Router Traffic Grapher
Click Image for Full-Size Visualization Back
  Last Modified: Tue Oct-13-2020 22:21:40 UTC
  Page URL: https://www.caida.org/projects/internetatlas/gallery/mping/visual.xml