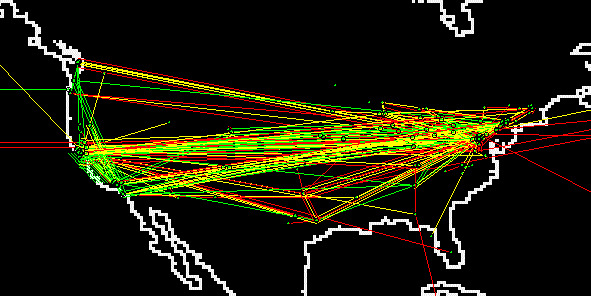
multicast backbone topology as queried by mwatch/mrinfo.
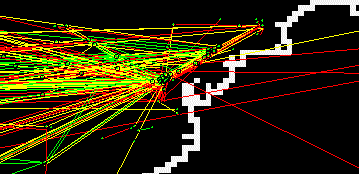 | ||
|---|---|---|
| yellow - tunnel | green - native | red - down |
(Note this paper uses a lot of color images for explanation and examples. Color printout strongly recommended. home URL: https://www.caida.org/publications/papers/1999/manta/)
MantaRay and Otter are part of the fleet of tools from the Cooperative Association for Internet Data Analysis (CAIDA) for visualizing various sets of Internet data. Both tools are Java-based and allow users to select parts of the data, focus or zoom in on particular areas, color by various parameters, and generally explore multicast topologies.
The tunneled MBONE works by connecting individual multicast-capable subnetworks with these logical tunnels whose endpoints encapsulate multicast packets into normal IP packets and send them across the unicast path between the tunnel endpoints. To non-multicast routers this traffic appears as normal IP traffic, while multicast routers treat it as IP encapsulated in IP, rather than the typical TCP or UDP encapsulated in IP. These multicast routers recognize such packets as special and process them accordingly: stripping the extra IP header to retrieve the multicast group destination, and consulting the multicast routing table to determine where to forward the packet, whether across native multicast links or across a tunnel to another multicast-capable router. Tunnel endpoints are either routers that support DVMRP or Unix workstations or workstation-based routers that have IP multicast support and run the multicast routing daemon mrouted. Currently the widest use of the MBONE is for real-time video and audio streams.
The next section offers a brief introduction to the multicast routing protocols that support the MBONE. We then describe the multicast data sets we analyzed, and aspects of the MBONE for which visualization could provide insight. Finally, we present an overview of Manta and Otter, the tools we used to visualize the multicast data, and provide example snapshots of various components of the multicast infrastructure.
There are two multicast routing protocols in common usage: DVMRP (Distance Vector Multicast Routing Protocol) and PIM (Protocol Independent Multicast). DVMRP originated with Steve Deering [DEER] and its canonical Internet implementation, mrouted, is currently maintained by Bill Fenner of Xerox PARC. PIM was defined by RFC 2117 [PIM] and implemented in Cisco routers by Dino Farinacci. A new multicast paradigm under recent development maps a multicast group to a single fixed source and a group of receivers [EXPR]. This model may be able to accommodate the requirements of many multicast applications, but is not yet implemented or deployed anywhere.
DVMRP infrastructure comprised the vast majority of the MBONE until routers began to support native multicast via PIM, which is what new participants tend to deploy as they add multicast support to their network. In addition, administrators of pieces of the DVMRP infrastructure are independently and gradually transitioning to PIM. We are now even seeing PIM clouds interconnect, similar to unicast exchange points, using the MBGP [MBGP] and MSDP [MSDP] protocols for inter-domain routing support (MBGP to discover topology and MSDP to help construct the inter-domain multicast distribution tree.) One important visualization possibility is to depict the relative prominence of various multicast routing protocols in the current Internet infrastructure (including which versions of each since significant functionality changes are not rare between versions).
The mwatch database was too large to gracefully use for testing while developing these visualization tools, so we built the crawl tool to produce smaller data sets. crawl starts with a set of root nodes (hostnames), a depth level, and then calls mrinfo on those root nodes. It then collects a list of all the hostnames they are connected to and repeats the process until it has reached the specified depth from these root nodes. Basically, crawl is a modified version of mwatch that can limit the depth of the mrinfo recursion to produce smaller, focused data sets.
As of August 1998, the size of the dataset generated by mwatch is currently about 4.5 MB; the execution time to traverse the entire MBONE topology increased from about 12 hours when mwatch was first run regularly at the University of Cambridge to over 24 hours as of August 1998. Our utility, crawl, generates a file of approximately 3.5 MB in 13 hours when run across the same scope in topology. The difference appears to derive from mwatch's inclusion of information from previous passes, while crawl retains only information collected in the current pass. The designers of mwatch might have included this memory feature to account for machines that temporarily disappear due to inclement network/host/configuration weather.
A sample of the mrinfo output follows:
198.17.46.39 (mbone.sdsc.edu) [version 3.255,prune,genid,mtrace]:
  198.17.47.39 -> 0.0.0.0 (local) [1/1/disabled]
  198.17.46.39 -> 198.17.46.56 (pinot.sdsc.edu) [1/1]
  198.17.46.39 -> 198.17.46.43 (cs-f-vbns.sdsc.edu) [1/1]
  198.17.46.39 -> 198.17.46.10 (medusa.sdsc.edu) [1/1]
  198.17.46.39 -> 198.17.46.205 (bigmama.sdsc.edu) [1/1]
  198.17.46.39 -> 138.18.5.224 (nccosc-mbone.dren.net) [1/32/tunnel]
  198.17.46.39 -> 192.215.245.10 (mbone.cerf.net) [5/32/tunnel]
  198.17.46.39 -> 198.202.127.101 (dasher.doct.sdsc.edu) [1/32/tunnel/down/leaf]
  198.17.46.39 -> 198.202.127.22 (itlhp1.doct.sdsc.edu) [1/32/tunnel/down/leaf]
  198.17.46.39 -> 132.249.30.13 (avatar.sdsc.edu) [1/1/tunnel/down/leaf]
  198.17.46.39 -> 132.249.30.6 (mithrandir.sdsc.edu) [1/1/tunnel/down/leaf]
The first line of mrinfo output shows that the host queried is mbone.sdsc.edu and it is running version 3.255 of mrouted with mtrace support. Each additional line represents a connection to another mrouter with characteristics listed in brackets. The word "tunnel" in the attributes means that a multicast path exists between mbone.sdsc.edu and the named host via encapsulated IP. Lines with no "tunnel" attribute are native multicast links, in this case to other mrouters on the local network.
Querying the medusa.sdsc.edu mrouter, mrinfo returns:
198.17.47.10 (medusa.sdsc.edu) [version 11.2,prune,mtrace]:
  132.249.30.10 -> 0.0.0.0 (local) [1/6/pim/querier/disabled/down/leaf]
  198.17.46.10 -> 198.17.46.43 (cs-f-vbns.sdsc.edu) [1/1/pim]
  198.17.46.10 -> 198.17.46.205 (bigmama.sdsc.edu) [1/1/pim]
  198.17.46.10 -> 198.17.46.56 (pinot.sdsc.edu) [1/1/pim]
  132.249.30.10 -> 132.249.30.6 (mithrandir.sdsc.edu) [1/6/pim]
  132.249.30.10 -> 132.249.30.7 (curunir.sdsc.edu) [1/6/pim]
  132.249.30.10 -> 132.249.30.11 (tigerfish.sdsc.edu) [1/6/pim]
showing that medusa is a Cisco router running IOS 11.2 with 6 neighbors. Note that medusa does not show its DVMRP neighbors on its local network, that is, the DVMRP Unix host mbone.sdsc.edu sees and reports its neighbor medusa, but medusa does not mention mbone.sdsc.edu. Cisco's running PIM know that they have DVMRP neighbors, but do not know who they are (i.e., don't retain neighbor state).
An mwatch or crawl traversal of the whole MBONE would never find mbone.sdsc.edu from medusa. Such a traversal is potentially incomplete since nodes can be down (skipped) and DVMRP tunnels can be hidden behind Cisco routers, both of which can create MBONE partitioning, black holes, and failed pruning situations. The last of these, failed pruning, can result in considerable extraneous copies of multicast traffic, imposing unnecessary load on the infrastructure.
Another data collection problem we have experienced is that mrinfo can not access information on nodes behind firewalls that filter IGMP (Internet Group Multicast Protocol) packets. Fortunately not every site's firewalls are so conservative, but it does poes an obstacle to obtaining a comprehensive picture.
Security for some sites also dictates that global routes are not advertised outside of their internal infrastructure. In such cases the mrinfo query may reach its destination mrouter, but may not be able to get a reply back for lack of a return path. Furthermore, misconfigured routers or incompatible software can also provide potentially inaccurate information, e.g., some routers run native multicast software that does not respond to mrinfo queries.
| DVMRP | mrinfo did not label the link PIM |
| PIM | mrinfo did label the link PIM |
| tunnel | mrinfo did label the link as a tunnel |
| native | mrinfo did not label the link as a tunnel |
| unidirectional tunnel | mrinfo sees one end of a connection but not the other |
/8 |
first (left) octet of IP address is the same for both endpoints |
/16 |
first 2 octets of IP address are the same |
/24 |
first 3 octets are the same |
/0 |
no leading octets the same |
| down | mrinfo reports tunnel is down |
| up | mrinfo reports tunnel is not down |
| uni | mrinfo does not report either tunnel or down, we assume native multicast |
| metric | mrinfo-reported routing cost |
| threshold | mrinfo-reported topology scoping parameter |
| degree | number of links connected to this node |
| multicast version | (otter only)numeric version of multicast software/OS |
Both of our visualization tools, Manta and Otter, label the above semantic attributes of the database as generated by mwatch and crawl. The keywords above appear in the menus and color legends associated with various displays as seen in the next section.
We have extended Mapnet to visualize the Internet multicast topology. The resulting tool, called MantaRay, displays the geographical placement of MBONE infrastructure, using data from the mwatch utility. A second tool, Otter, displays topological views of the (same) multicast infrastructure. Otter is derived from Manta and from Plankton [PLANK], the latter tool originally developed to visualize the NLANR Squid Cache Hierarchy.
In both visualization tools we will describe, MantaRay and Otter, nodes represent multicast capable hosts and routers. As mentioned earlier, links represent either native multicast peering, or a tunnel between two multicast nodes through non-multicast speaking nodes. The main difference is that MantaRay is limited to geographic depiction while otter can support topological layout as well.
multicast backbone topology as queried by mwatch/mrinfo.

yellow - tunnel
green - native
red - down
We pursued a variety of approaches and heuristics for finding geographical coordinates. Often the closest we could get was the InterNIC database records for the domain name that corresponded to the IP address. These records contain one geographical location per each entire domain (the `headquarters'), which may have no relation to the location of the particular IP address we need to locate on the map. If the IP address does not map to a domain name, one can attempt to map it directly to an autonomous system (AS) via a core BGP routing table and then use the InterNIC-registered headquarters location for that autonomous system. This method involves the same problematic assumption, particularly unaccepable for mapping nodes of national backbone service providers. Nonetheless we derived a basic image which we can then refine as we gain more accurate location data. Note: to help with such visualization studies, we encourage service providers to put geographical information into their DNS configuration as outlined in RFC 1876 [DNSL].
Figure 2: The small window displays information for the white link.
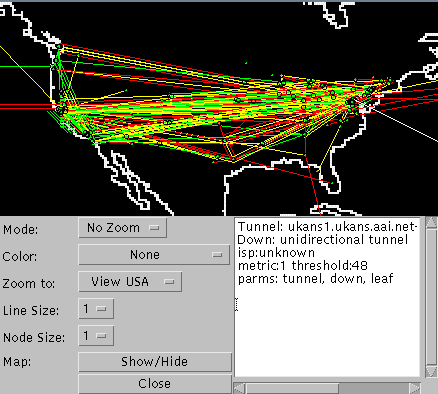
Manta identifies nodes and links in the status text window on the lower right of the java applet window. When the mouse moves over a link or node, this window contains raw data corresponding to that object in the database, as shown in figure 2.
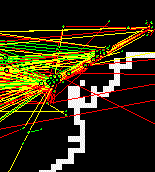
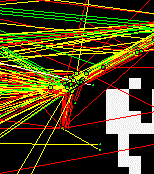
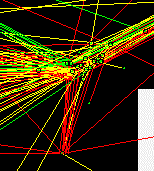
Manta can zoom and focus on a particular geographic region. Figure 3 below shows the Washington DC area shown in Figure 2, at three levels of granularity: full size, zoomed in once (2X), and then zoomed again (4X). Unfortunately, zooming in too far magnifies the background world map image so much as to become almost useless for geographical identification.
Washington DC is a rich area with respect to network connectivity and there are many nodes and links in close proximity. Manta adjusts the positions of nodes if their geographical information would place them on top of each other. For multiple links between the same two cities, Manta draws distinct parallel lines, which although distorting the geographic representation, provides a more compelling sense of the connectivity. The granularity of the geographic information is often at the level of city rather than exact lat/longs, so there are also many placement collisions in larger cities althought the ISPs points of presence are likely spread across the city.
| Full size (100%) | Zoomed once (50%) | Zoomed twice (25%) |
|---|---|---|
 |
 |
 |
| yellow - tunnel | green - native | red - down |
yellow - tunnel
green - native
red - down
A link with a node of degree X at one end and of degree Y at the other end is colored with the color corresponding to the larger of X and Y. Similarly for links with differing thresholds and metrics. A threshold value of 0 is used for native PIM links, since PIM does not use the concept of threshold for forwarding.
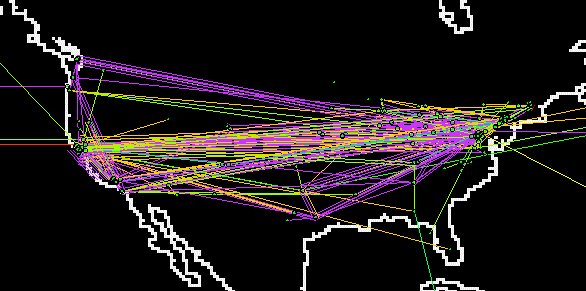
There are two coloring modes: spectrum mode and binary mode. Spectrum mode sorts the values into buckets and assigns each bucket a color. Spectrum displays include a color legend. Figure 5, is an example of spectrum coloring.
Figure 5: Color by metric (spectrum):

In contrast to spectrum mode, which uses an array of colors, binary mode uses uses only two colors. Binary mode uses the truth value of a boolean statement to determine color: blue for false, yellow for true. The user specifies the desired boolean expression via a pop-up window. Objects with no value for the specified attribute are ignored. For example, we can color all links with metric less than 10 yellow (true) and all others blue (false). In binary mode, Manta can also hide (mask) all links for whom the boolean value of the given statement is false.
Figure 6: Threshold greater than 32
Yellow links with threshold > 32
Gray links with threshold <= 32
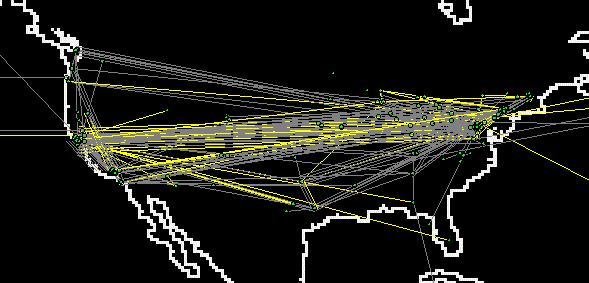
Figure 7: Only nodes/links with degree > 10
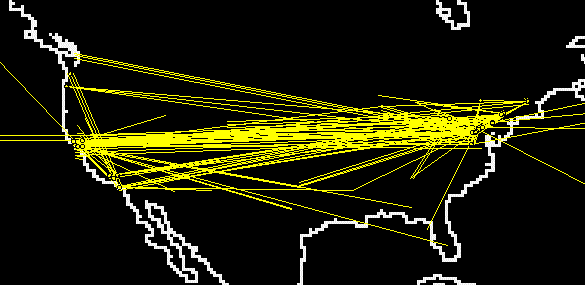
Figures 6 and 7 are examples of binary coloring.
Note that metrics and thresholds are quantities associated
with directional links between nodes.
Since we display links unidirectionally,
we assign a 'true' color to the link if it meets the
condition in both directions.
MantaRay's visualizations rely on geographical placement
of the nodes, a serious drawback since the latitude/longitude data
available is incomplete.
In July we ran a complete mwatch traversal of the
multicast backbone, with a data file comprised of
approximately 10,000 nodes and 25,000 links.
Only about 40% of those nodes were in our lat/long database.
To overcome this limitation, we pursued methods for visualizing
topology that would not rely on difficult-to-obtain
geographic information. Using techniques developed for
Plankton [PLANK],
CAIDA's tool for visualizing the NLANR web caching hierarchy,
we extended the software platform to support more general
topological visualization tasks. We've called the resulting tool
Otter.
Much of the data in sample Otter
graphs is from the output of crawl.
There are currently two different methods for arranging root nodes:
(1) circular, which places root nodes on the circumference of a circle;
and (2) semi-geographical, which places roots based
on lat/long information.
For semi-geographical placement, Otter finds the
maximum and minimum latitude and
longitude coordinates of the complete set of root nodes
in the data file, and uses these values
to determine the four corners of a rectangle,
which Otter then scales to occupy half the viewing area.
The upper left corner represents the highest latitude and
longitude values; the lower right corner the lowest values.
Otter then places the root nodes within the rectangle in their
corresponding semi-geographical location. Root nodes that do not have
associated lat/long data are placed according
to the algorithm used for non-root nodes, described
in the next paragraph.
Semi-geographical placement can cause clusters of nodes in
metropolitan areas to overlap. For viewability, Otter
separates these clusters so that nodes are at
least the length of their diameter from each other.
After placing the roots, Otter places non-root nodes
in semi-circles around their parent node
using a breadth-first scan from the roots
and guided by the following heuristics:
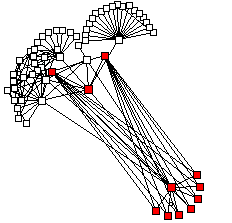
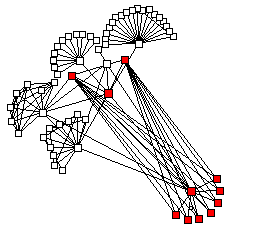
Figure 9 below shows examples of both
semi-geographial and topological layout for
mrinfo data on BBNplanet's
multicast infrastructure in July 1998.
In these Otter visualizations of multicast topology,
red nodes are "roots", and
represent the starting set for the crawl run that
produced the data set. We typically select as root nodes
known multicast routers of large ISP domains.
White nodes are also multicast capable routers, but not in the root set.
Links represent Internet paths over which multicast traffic
may flow, either as native multicast (with both endpoints participating)
or as encapsulated tunneled traffic. Intermediate routers that do
not understand multicast are not shown.
Otter has the same display focus, zoom, and manipulation
capabilities illustrated for Manta earlier.
One can often improve the layout of the autoplacement
algorithms with manual adjustment;
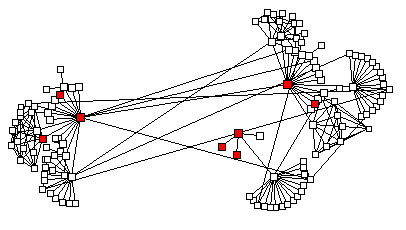
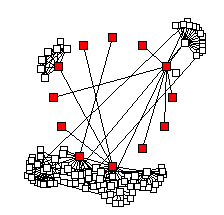
figure 10 shows a particular layout before and after hand tuning.
The root nodes are from the domain sdsc.edu,
the San Diego Supercomputing Center.
Crawl generated the data using a depth parameter
of three; Otter is using topological placement.
Figure 10: SDSC multicast infrastructure, before and after
hand-tuned placement (July 1998)
One can also label or color nodes by domain name,
as shown in Figures 11a and 11b.
Figure 11a: SDSC labeled with host names (July 1998)
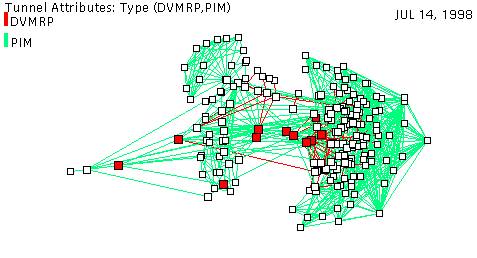
Coloring by tunnel status shows the distribution of DVMRP, PIM,
and broken tunnels. DVMRP peers are labeled "tunnel", PIM peers
"native", and others either "unidirectional", meaning a DVMRP
host hidden by a Cisco router, or "down", meaning that one end
of the tunnel is not configured correctly or the mrouter is
actually not reachable or not running a multicast routing daemon.
Coloring by multicast version shows which version of either
mrouted or IOS.
This coloring also provides some indication of the transition
to native multicast: values such as 11.2 are Cisco IOS version
numbers (which support native multicast via PIM),
while 3.8 refers to mrouted and 3.255 to the DVMRP protocol.
A tunnel metric represents the routing `cost' to send
packets over that link.
It is typically not used unless a host has multiple tunnels via providers
and wants to load them differently. Most sites just set the value to 1.
Metric can be used to provide redundancy via backup
tunnels that take over if the primary tunnel with
lower metric is down. The values for metric and threshold
are typically negotiated by the system administrators of
the tunnel endpoints when they establish the tunnel.
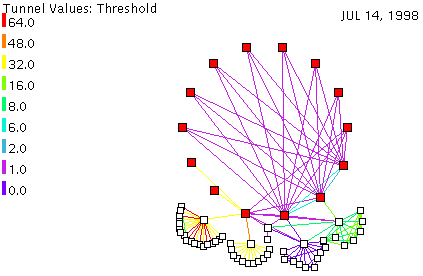
Coloring by threshold can yield insight into scoping across sites.
Packets will not be forwarded over a link with threshold X, unless
they have a ttl (time to live) value greater than X. Many sites
try to use the threshold parameter to limit, or
administratively `scope', the propagation of
their multicast sessions, e.g., internal video conferencing,
so they do not escape to the global internet.
The ability to display such multicast
link parameters and network topology can help network
engineers find configuration or design problems.
By looking at tunnel status, multicast version, and multicast
protocol over time, one can also gauge the rate of change toward
native multicast in the infrastructure.
Otter has some limitations in visualizing large data sets:
Java is still rather slow and suboptimally stable.
However Otter does support the manipulation of interactive
visual depictions of smaller topologies.
Crawl can gather a restricted dataset
and use Otter to visualize multicast topology,
connectivity, and design.
ISPs might also want to use Otter to verify that their multicast
configuration as seen by mrinfo is sensible,
and does not contain loops or other quirks that
might generate duplicate packets.
In collecting this data, we noticed that parts of
many multicast infrastructures of ISPs do not respond to our queries,
and thus appear in Otter as disconnected or partitioned.
There are a variety of possible reasons:
firewalls blocking our probes, routing, or misconfiguration.
We have run our crawl script on several
national ISP's multicast infrastructure, including
that of MCI for a case study we present below.
Appendix A contains several other visualizations of
various ISP's multicast infrastructure.
This security-related configuration aspect of their backbone
routers allowed mrinfo queries to reach MCI mrouters but
did not allow responses from those mrouters
to get back to our probe machines.
After MCI added to those mrouters a route to reach
our probe host, crawl was able
to find, and Otter thus able to draw, the fully-connected MCI
multicast infrastructure.
Figure 12 shows the different partitions that
crawl initially found in MCI's multicast network.
We leveraged an Otter feature intended for something else
to determine the actual number of connected components.
Specifically, Otter allows the user to specify which
nodes to use as `root nodes' by entering a search string
and then rendering as root nodes all nodes with that string
in their name.
If no matches occur, Otter will by default
randomly use a single node from each connected component of the graph
as the set of root nodes.
Typing in a nonsense string causes Otter's search to
fail, so it will use the default algorithm instead. This mechanism
found the disconnected components in the mci.net multicast
infrastructure when visual inspection had failed to discern them.
In the next version of Otter, identifying and labeling connected
components will be a standard feature.
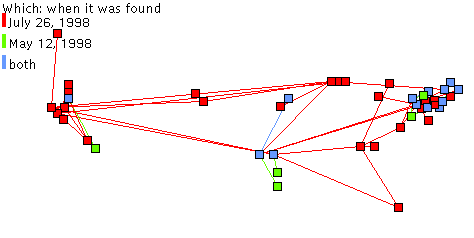
Figure 13 shows the correct connected MCI multicast network after
the routing information had been changed to allow answers to
our queries to reach us, notably larger
than that seen in Figure 12 before the routing change.
In response to these limitations, we developed Otter to support
topological and semi-geographical placement algorithms, allowing
the network engineer to view his infrastructure at a more abstract level.
Note that this method can render the proximity of nodes in
the graph misleading,
since there is no relation to physical distance.
A major limitation of both tools is the mwatch/mrinfo data
itself. Firewalls and routing policies that block the mrinfo
queries and/or answers leave holes in the data that we can collect.
Thus any visualization of the multicast infrastructure based
on this data collection method is just a snapshot of the
mrouters reachable at a fixed point in time from our query machine.
Also, the two major multicast routing protocols still do not always
interoperate well together. A PIM-speaking router connected
with a tunnel
to a DVMRP mrouter with a direct connection on the local network
will not acknowledge to mrinfo that the connection exists.
The tunnel will thus appear in the database as unidirectional, with
the DVMRP side announcing it and the PIM side denying it. Unless
there is an alternative path to that DVMRP mrouter, it will not
appear in the data set collected.
Despite the limitations,
we hope that these tools will allow ISPs and organizations deploying
multicast infrastructure to easily visualize its topology and
aspects of its configuration. Such tools can facilitate
timely detection and correction of misconfiguration or poor design
decisions.
One obstacle with continued mbone visualization
research is that the mwatch caretakers have stopped
ongoing operational maintenance and execution of the code.
We will need to find or provide support for continuous operation of
either it or another scalable crawl-like tool.
We would also like to support animation capabilities
to allow organizations to track deployment of their own
multicast infrastructure.
Finally, we would be grateful for the opportunity to
run crawl from multiple sites at the same time
to see how the location of the querying machine
impacts the data collected.
Piete Brooks from the University of Cambridge clarified the
history of mwatch for us and gave us access to its database.
Thanks Piete.
Nancy Bachman rescued us once again with
her helpful comments and edits.
We extend special thanks to Doug Pasko and
Jeff Young, then iMCI engineers who helped us solve the disconnected
graph problem and added our measurement probes to their routing tables.
We provide
several examples of typical Manta and Otter displays
that would be easy for the network engineer
to customize for their own network.
We have also included the domain cisco.com
because it has an extensive multicast infrastructure.
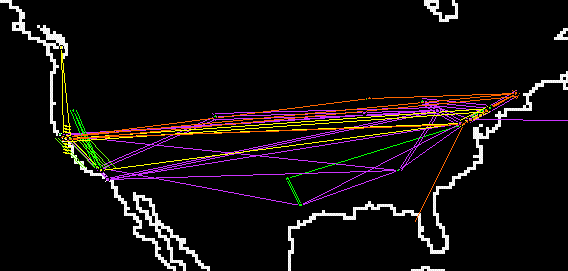
These graphs illustrate different Otter features
and are in no particular order.
Dataset: ans.net, crawl depth 2

Limitations of Manta
Otter: general-purpose visualization
The feature set of Otter is richer than that of Manta. We will again
illustrate with visualizations of the multicast data that allow us
to take large ASCII data sets and usefully illustrate
multicast topology, broken configurations, tunnel peering
relationships, and the extent and rate of native
multicast deployment in the commercial Internet.
Otter's graph layout algorithms
Otter's initial layout algorithms derived from those of the
Plankton
tool for visualizing the NLANR Caching Hierarchy [IRCHE].
Otter places "root" nodes first, where roots and
their locations are specified in the data file, and,
like any other nodes, subject
to user adjustment when running Otter interactively.
semi-geographical layout
topological layout
Before
After
Like Manta, Otter identifies raw database attributes
of nodes and links in the status text field on
the lower right of the java applet window,
according to which link or node the mouse sits on.
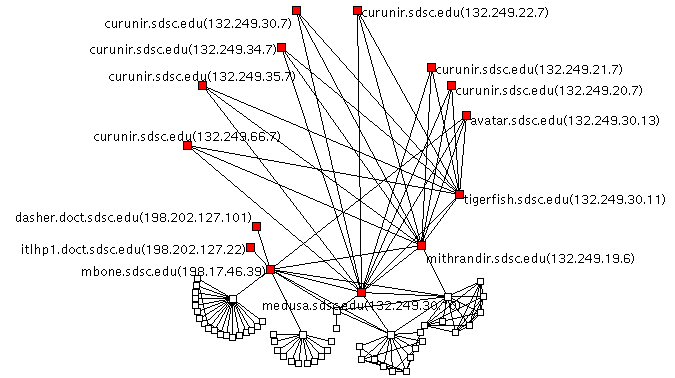
Figure 11b: SDSC colored by second level domain (July 1998)
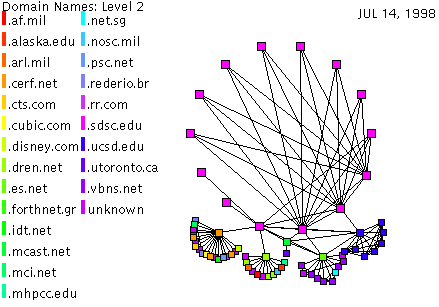
Figures 12a-d illustrate how Otter uses color to display specific
attributes of multicast infrastructure. In each case, the graph
displayed is the SDSC multicast network drawn with the
circular placement algorithm.
Figure 12a: Color by tunnel status (sdsc.edu, July 1998)
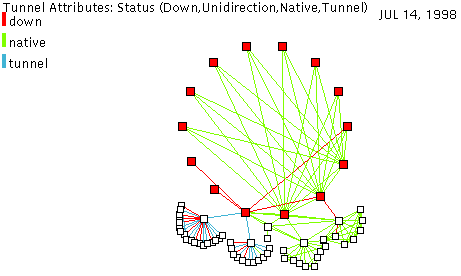
Figure 12b: Color by multicast version (sdsc.edu, July 1998)
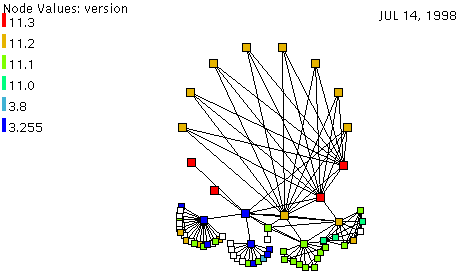
Figure 12c: Color by tunnel metric (sdsc.edu, July 1998)
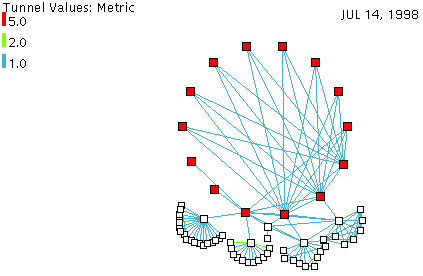
Figure 12d: Color by tunnel threshold (sdsc.edu, July 1998)
Otter's utility for ISP's
Internet Service Providers Multicast Infrastructure
Partitioning: a case study
When we first examined Internet MCI's (sold to Cable & Wireless
in 1998) multicast infrastructure, using data
either from the mwatch database or from a crawl run,
Otter displayed iMCI's MBONE connectivity as 6 separate
disconnected subgraphs. We knew that
the nature of multicast requires a connected distribution graph
and concluded that our mrinfo data must be incomplete.
We suspected that firewalls were blocking our queries to
mrouters. However, correspondence with MCI engineers
clarified that the MCI mrouters did not have a default
unicast route, only a few specific
routes within their internal infrastructure.
Figure 12: Partitions of MCI as seen by mwatch May 12, 1998
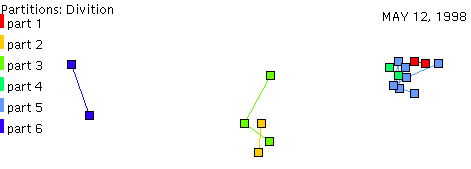
Figure 13: The MCI multicast network differences, July 26
Conclusions
Manta's geographical depiction of the multicast infrastructure
overlaid on the familiar U.S. or world map allows network engineers
to verify connection and link status in an intuitive way. However,
the difficulty of obtaining accurate latitude and longitude data for
each node severely limits its usefulness and extensibility.
Our mechanisms for resolving lat/long information: ferreting it out
of sources like the ARIN or InterNIC databases for each domain location,
friends who work at the institution in question, knowledge of
the host naming scheme, or other ad hoc methods, have suboptimal
scaling properties to say the least.
And many network topologies are so densely populated that
so geographic depiction often leaves many nodes so
close together as to detract from visability of the graph.
Future Directions
In the future we hope to use Manta and Otter to
track evolution of the multicast infrastructure
over time, in particular the trends as we move from DVMRP to PIM or
other multicast routing protocols, or to more recent versions of
router software.
Actually we hope to evolve Otter to embody
all the functionality of Manta so that we would not
have to support both tools. The main requirement is
to integrate into Otter the strong geographical binding
of Manta's implementation,
which allows more optimized geographic depiction.
Availability
Both MantaRay and Otter are freely available. We encourage network
engineers responsible for an ISP's multicast infrastructure to play
with them and provide feedback on their usefulness and suggestions
for new features that would be helpful in managing a
robust multi-provider multicast infrastructure.
Application Applet Source Code
Manta
no longer supported by CAIDA
Otter
https://www.caida.org/tools/visualization/otter/mbone/
https://www.caida.org/tools/visualization/otter/source
Acknowledgements
We would like to thank Bill Fenner of Xerox PARC for his
help in interpreting the mrinfo output and for
explaining DVMRP/PIM intricacies.
References
 [DEER]  D. Waitzman, C. Partridge, S.E. Deering,
	 "Distance Vector Multicast Routing Protocol,"
	 http://www.census.gov/rfc/rfc1075.txt.gz, RFC 1075, Nov-01-1988

 [DNSL]	 C. Davis, P. Vixie, T. Goodwin, I. Dickinson,
	 "A Means for Expressing Location Information in the DNS",
	 http://www.kei.com/homepages/ckd/dns-loc/, RFC 1876, Jan-15-1996

 [DVMRP] Pusateri, T. "Distance Vector Multicast Routing Protocol",
	 draft-ietf-idmr-dvmrp-v3-07.txt, August, 1998.

 [EXPR]  Cheriton, D.  "EXPRESS Multicast: An Extended Service Model for
	 Globally Scalable IP Multicast", submitted for publication,
	 September 1998.

 [JC]	 J. Crowcroft, I. Wakeman, M. Handley, S. Clayman, P. White,
	 "Internetworking Multimedia,"
	 http://ee.mokwon.ac.kr/~music/tutorials/mmbook/, UCL Press, 1996

 [MANTA] Java Application for viewing the Multicast network,

 [MAPN]  K. Claffy, B. Huffaker,
	 "Macroscopic Internet visualization and measurement,"
	 https://www.caida.org/tools/visualization/mapnet/summary.html, CAIDA, Mar-15-1997

 [MBGP]  T. Bates, R. Chandra, D. Katz, Y. Rekhter,
	 Multiprotocol Extensions for BGP-4", RFC 2283, February 1998.

 [MRIN]  Jacobson, V., mrinfo,
	 http://www.cl.cam.ac.uk/Seminars/mbone.html.

 [MSDP]  Farinacci, D., "Multicast Source Discovery Protocol (MSDP)",
	 http://www.ietf.org/internet-drafts/draft-farinacci-msdp-00.txt,
	 June 1998 (work in progress).

 [MWAT]  Collection of Multicast information,
	 http://www.cl.cam.ac.uk/Seminars/mbone.html

 [OTTER] Java Application for viewing various Network Data,
	 https://www.caida.org/tools/visualization/otter

 [PIM]	 D. Estrin, D. Farinacci, A. Helmy, D. Thaler, S.  Deering,
	 M. Handley, V. Jacobson, C. Liu, P. Sharma, and L. Wei,
	 RFC 2117: Protocol Independent Multicast-Sparse
	 Mode (PIM-SM): Protocol Specification. June 1997.

 [PMUL]	 T. Munzner, K. Claffy, B. Fenner, E. Hoffman,
	 "Planet Multicast: visualization of the Mbone,"
	 http://oceana.nlanr.net/PlanetMulticast, NLANR, Oct-30-1996

 [PLANK] B. Huffaker, J. Jung, D. Wessels, K. Claffy,
	 "Visualization of the Growth and Topology of the NLANR Caching
	 Hierarchy,"https://www.caida.org/tools/visualization/plankton/Paper/plankton.html,
	 CAIDA, Mar-30-1998

 [VBNS]  very high performance Backbone Network Service,
	 http://www.vbns.net
Appendix A: Otter visualizations of various ISP's multicast
infrastructure
Placement: topological with hand tuning
Color: by threshold
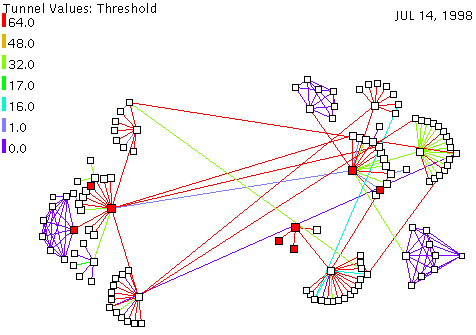
Dataset: bbnplanet.net, crawl depth 2
Placement: cluster experiment - nodes are clustered by IP address
Color: by tunnel type
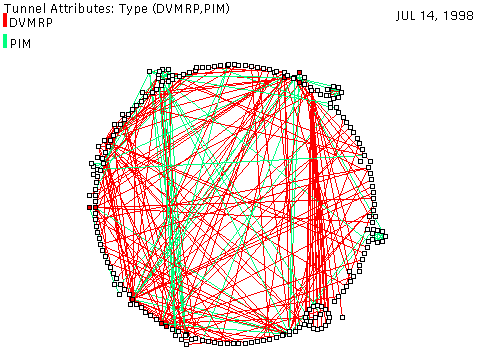
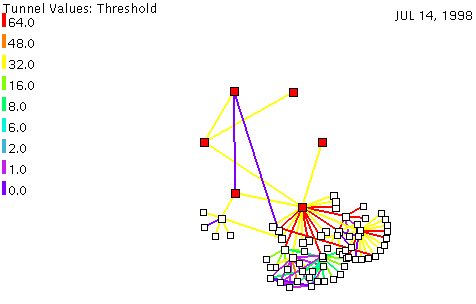
Dataset: cerfnet.net, crawl depth 2
Placement: topological
Color: by threshold (with line size increased)
Placement: topological
Color: by multicast protocol
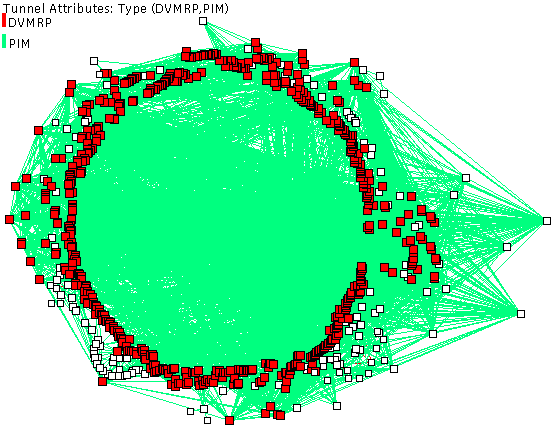
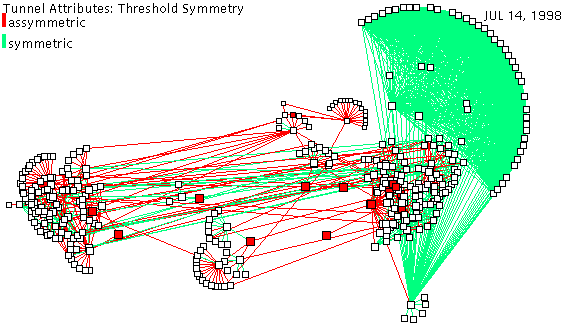
Dataset: mci.net, crawl depth 2
Placement: semi-geographical
Color: by threshold symmetry between directions
Dataset: sprintlink.net, crawl depth 2
Placement: semi-geographic
Color: protocol-type-(ip match between nodes)
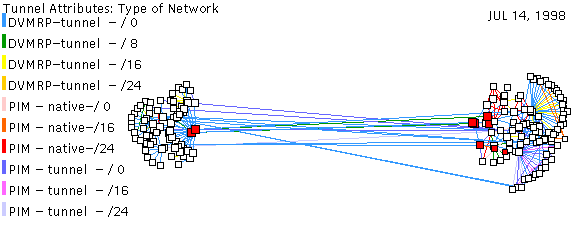
Dataset: uu.net, crawl depth 2
Placement: semi-geographical
Color: by threshold
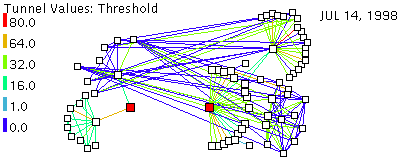
Dataset: vbns.net, depth 2
Placement: semi-geographical
Color: by multicast protocol
