K. CLAFFY, TRACIE E. MONK & DANIEL McROBB
No aphorism is more frequently repeated...than that we must ask Nature a few questions, or ideally, one question at a time. The writer is convinced that this view is wholly mistaken. Nature, he suggests, will best respond to a logically and artfully thought out questionnaire; indeed if we ask her a single question, she will often refuse to answer until some other topic has been discussed. -- Sir Ronald A. Fisher, Perspectives in Medicine and Biology, 1973.
The infrastructure of the Internet can be considered as the cyber equivalent of an ecosystem. At its heart is a mesh of interconnected backbone networks. This core is rapidly evolving and provides the underpinnings that will be vital for future national and international communications.
The last mile connections from the Internet to homes and businesses are supplied by thousands of small and medium sized Internet Service Providers (ISPs), which are in turn interconnected by 'arteries' maintained by transit (backbone) providers. The global infrastructure of the Internet consists of a complex array of telecommunications carriers and providers, a very difficult infrastructure to analyze diagnostically except within the borders of any individual network. Nonetheless it is critical for the evolution of the Internet that insights into its overall health and scalability are obtained1-3.
New connections among core Internet backbones are made hourly, ranging in capacity from T1 copper cables (1.55 megabytes per second) to OC48 fibre optic pipes (2.48 gigabytes per second). This physical structure supports a myriad of new technologies and products, including live (or 'streaming') audio and video, distance education, entertainment, telephony and video-conferencing, as well as numerous new and often still evolving communications protocols. With no central authority serving to regulate and quality check, nor any feedback structure to throttle unfriendly practices or products, the Internet will continue its unbounded growth.
Attempts to adequately track and monitor the Internet's evolution were greatly diminished in early 1995 when the National Science Foundation (NSF) relinquished its stewardship role over the Internet4. The resulting transition into a competitive industry for Internet services left no framework for the cross-ISP communications which are needed for engineering or debugging of network performance problems and security incidents. Nor did competitive providers, all operating at fairly low profit margins, consider it to be in their best interests to build such a framework at that time.
As a result, today's Internet industry lacks any ability to evaluate trends, identify performance problems beyond the boundary of a single ISP, or prepare systemically for the growing expectations of its users. Maps depicting the structure and topology of this amorphous global entity are non-existent.
Mapping the Internet ecosystem
To gain insights into Internet traffic and workloads, the Cooperative Association for Internet Data Analysis (CAIDA) is developing and deploying tools to collect, analyze and visualize data on connectivity and performance across a large proportion of the Internet. These tools and analyses will provide windows on the infrastructure for network operators, designers and researchers, using a process somewhat analogous to medical 'catscanners' and which we thus refer to as computerized tomography.
Our principal tomography scanning tool, skitter, dynamically discovers and depicts global Internet topology and measures the performance of specific paths through the Internet. In essence skitter sends out packets of data from a source to many destinations through the Internet. The information gained about the paths that these packets take can then be used in four different ways.
It is essential that skitter measurements impose only a minimal load on the infrastructure (that is hosts and routers along the way) as it takes its measurements. skitter packets are thus very small, 52 bytes in length, and typically only probe destination hosts at approximately hourly intervals.
But how do we anticipate these skitter data sets can be used?
Network Connectivity
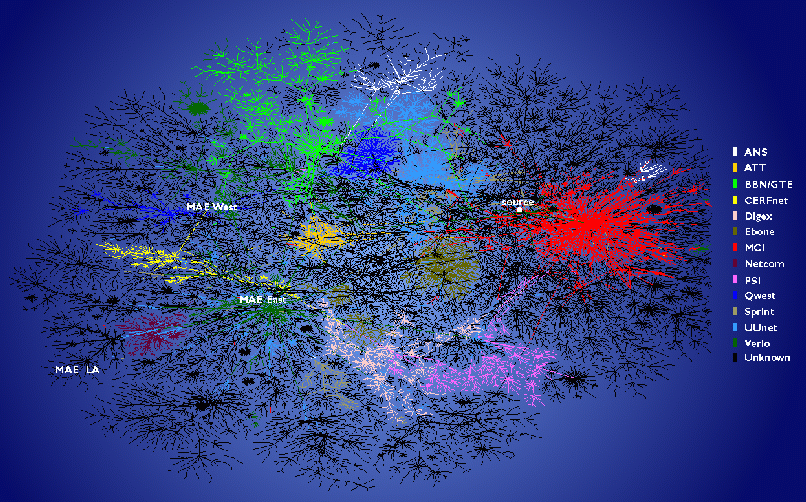
By analyzing data from tens of thousands of path measurements, particularly critical paths can be identified. Visualization of these data also highlights the pivotal roles that specific backbones, traffic exchange points, and even individual routers (the devices that direct and carry packets through segments of the network), play in transmitting Internet traffic. A preliminary two-dimensional visualization of skitter data depicting a macroscopic snapshot of connectivity networks is shown here (Fig. 1) with selected backbone ISPs coloured separately. The graph reflects 23,000 end destinations, through many more intermediate routers. While visually interesting, the volume of data represented in the figure greatly reduces its utility to operators and users alike.
|
Figure 1 Prototype two-dimensional image depicting global connectivity among ISPs as viewed from skitter host. |
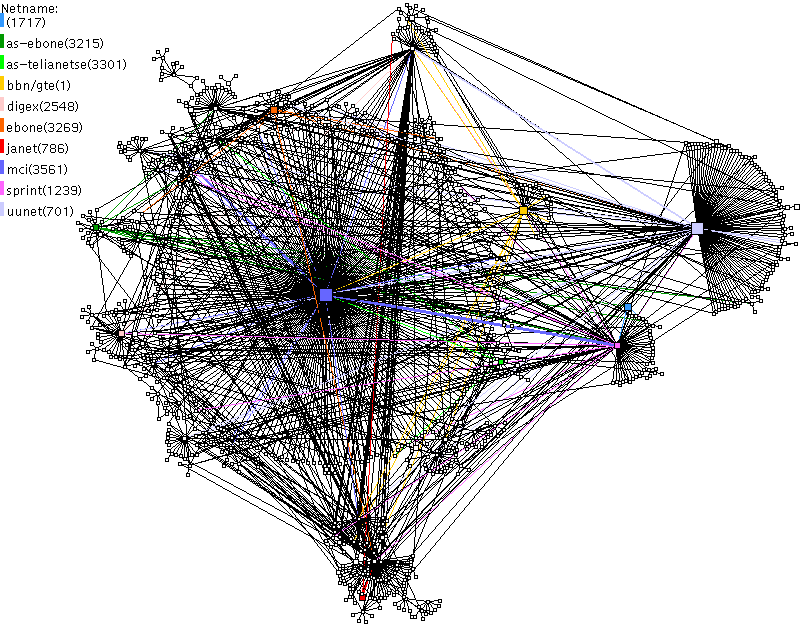 |
Figure 2 Interconnection relationships among key Autonomous System networks on December 3, 1998 as viewed from skitter host. |
Even such aggregated, two-dimensional representations of this data prove limited. We are currently exploring possible methods for three-dimensional visualization of topology and RTT performance across segments of the infrastructure, such as Munzner's hyperbolic space techniques5.
The critical role that certain ASes play in forwarding traffic across the Internet is illustrated in table 1. Using samples from monitors covering 20,588 end destinations, we determined the frequency with which an individual AS appeared in a path and the relative depth of those appearances, both in terms of number of ASes and the number of hops from the source monitor. In this example, CerfNet/AT&T, Cable & Wireless (which purchased InternetMCI's backbone in 1998), Sprint, and UUNET (part of MCI/Worldcom) play major roles in transporting packets across the infrastructure.
Routing
The robustness and reliability of the Internet are highly dependent on efficient, stable connections and routing among provider networks. An analysis of real world trends in routing behaviour across the Internet will have direct implications for the next generation of networking hardware, software and operational policies. Observations of macroscopic traffic patterns provide insights into:
CAIDA can currently analyse skitter path data over time. This allows the comparison of actual routing behaviour with routing policies (border gateway protocol (BGP) route announcements), and identification of optimal routes given performance results.
Performance (Network and Hardware)
To improve the accuracy of its round-trip time measurements, CAIDA added a 'kernel module' to the operating system (FreeBSD for Unix) on which skitter runs. This module 'time stamps' the data that is collected by skitter, which may be insufficient for one-way measurements or detailed correlation across skitter platforms, but it does provide an indication of variations in performance across the Internet infrastructure. By comparing data from various sources, analysts can identify points of congestion and performance degradation or areas for improvements in the global infrastructure.
To aid performance testing of Internet hardware and evaluation of performance across specific paths, a skitter module called skping can be used at high resolution. Initial measurements of operational routers (Fig. 3) have identified statistically significant problems on certain routers that use network route cache technology: there are a number of RTTs longer than 250 ms. Data from routers running more recent (non-caching) software (for example Fig. 4) do not reflect these performance problems.
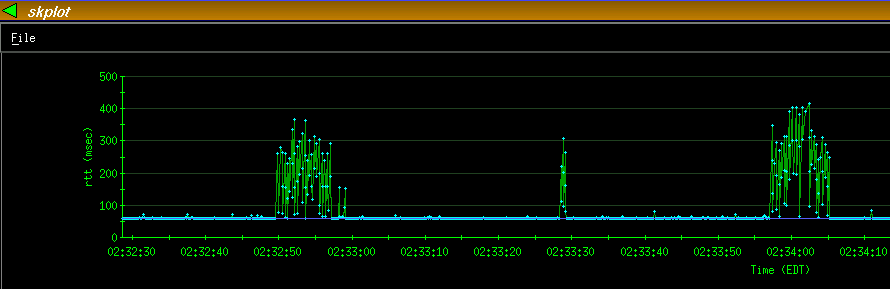 |
Figure 3 skping can be used to identify anomalies associated with specific Internet hardware, such as these periodic performance problems associated with prefix caching on routers. |
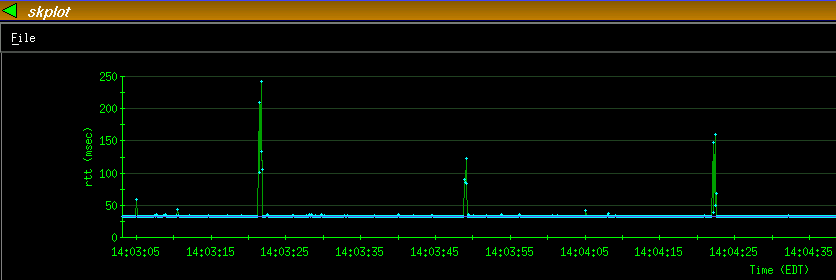 |
Figure 4 Routers running more recent, non-caching software do not demonstrate systematic performance problems. |
Time-series analyses of the number of packets that are lost in transit (shown as a cumulative percentage of approximately 10% in Fig. 5) highlight instabilities that are caused by sustained routing queues. The last 1,600 points of this dataset, shown in a histogram (Fig. 6), depict a relatively symmetrical distribution of RTTs, indicating that the cause of the losses is likely to be congestion or global synchronization at a specific link.
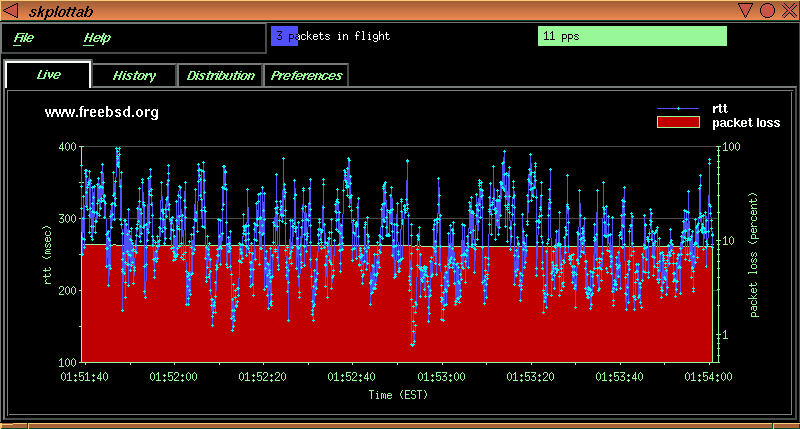 |
Figure 5 Time series analyses of traffic between a skitter host and www.freebsd.org suggests congestion or global synchronization at a specific link. |
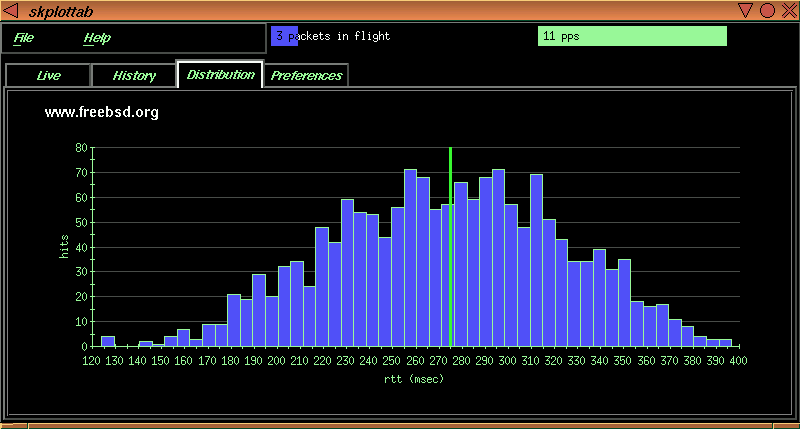 |
Figure 6 A histogram of the skping data reveals a median round trip time performance of roughly 275 ms for the last 1,600 data points. |
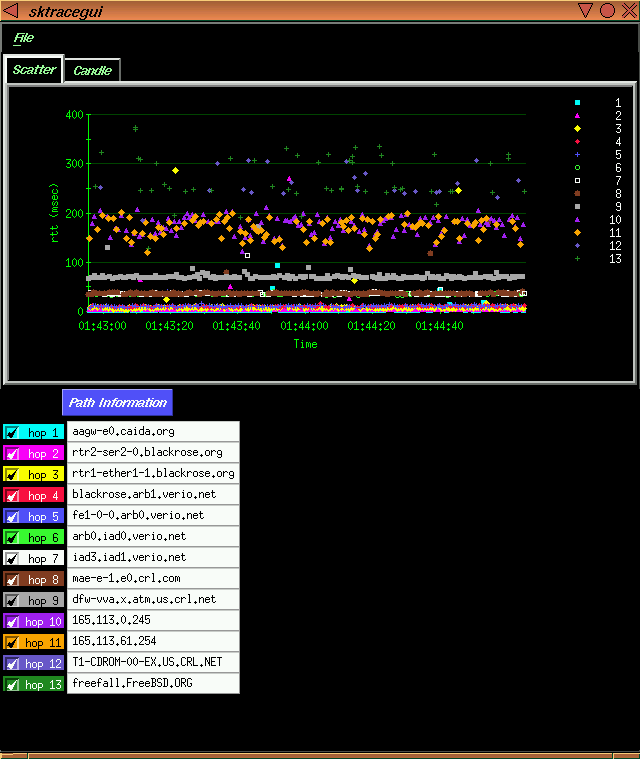 |
Figure 7 Scatterplot of sktrace data suggests congestion along the path. |
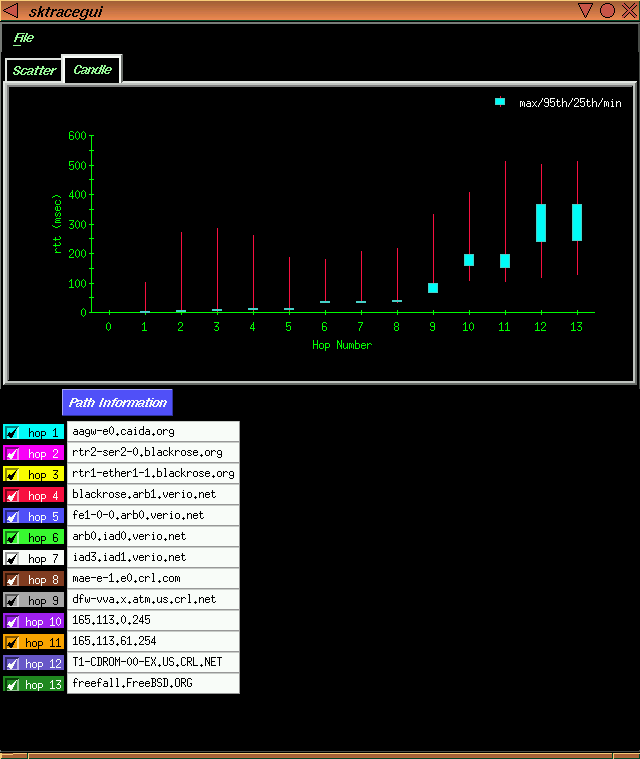 |
Figure 8 A 'candleplot' pinpoints congestion starting at the 12th hop in this path. |
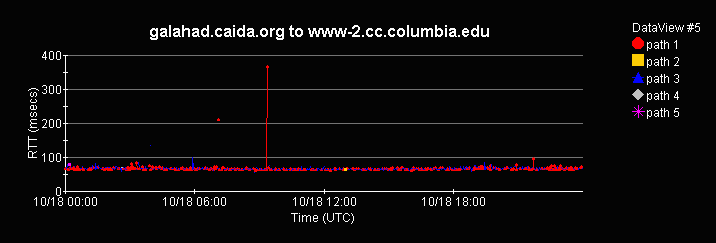 |
Figure 9 skping results showing minimum performance variation among paths, suggesting the possible presence of load balancing among routers. |
 |
Figure 10 Route instability, as shown by this graph, led to variations in round trip performance ranging from 98 to 163 ms between the same two hosts. |
Without adequate monitoring and analysis of the behaviour of traffic across the Internet, the ability of this promising infrastructure to continue growing and achieving its full potential may be compromised. Efforts to deploy tomography tools by CAIDA and others are only preliminary steps toward maintaining and evolving the capability to watch over the Internet as it moves into its second decade.
References
Acknowledgements. Many thanks to Bill Cheswick and Hal Burch (Lucent/Bell Laboratories) for providing the graph layout code for Figure 1.
K. Claffy, Tracie E. Monk
and Daniel McRobb
are members of CAIDA, a collaborative organization supporting cooperative efforts
among the commercial, government and research communities aimed at promoting a
scalable, robust Internet infrastructure. CAIDA is based at the University of
California's San Diego Supercomputer Center (SDSC). Support for these efforts
is provided by CAIDA members and by the Defense Advanced Research Project Agency
(DARPA), through its Next Generation Internet program, and by the National Science
Foundation (NSF). More information is available at https://www.caida.org.
*Other connectivity assessment tools, such as the original traceroute from Van Jacobson, also use this technique for determining Internet paths, though skitter uses ICMP rather then the UDP packets of traceroute (that is packets using a different protocol) For more details see the design documents on Skitter's home page: https://www.caida.org/tools/measurement/skitter/