![[CAIDA - Center for Applied Internet Data Analysis logo]](/images/caida_globe_faded.png "Go to CAIDA home page")
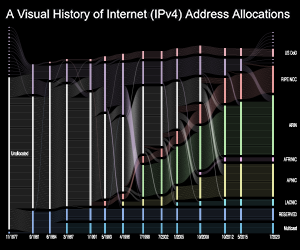
An animated slideshow presentation of the history of IPv4, using a Sankey diagram to visualize the flow of IPv4 address allocations since inception in 1977, through various address management organizations and policies.
Center the viewer below and use the navigation above the graph to advance through the presentation or autoplay.
×
![]()
Funding support