The Named Data Networking (NDN) project makes use of the CCN (Content-Centric Networking) architecture developed at the Palo Alto Research Center (PARC). The NDN project participants experiment, conduct research, and build applications that make use of the emerging CCNx Protocol.
We measured the performance metrics for the modified greedy forwarding algorithm in the NDN testbed. We report the results for the full graph of participating sites as well as for all the graphs obtained from the full graph by removing one link without disconnecting the full graph.
For more information about CAIDA's participation in the NDN project, see the CAIDA NDN Project page.
Modified Greedy Forwarding (MGF)
The paper [HCGN10] describes how the hyperbolic metric space underlying complex networks enables efficient greedy forwarding (GF) without any global knowledge of the network topology. Since each node in the network has its coordinates in this hidden metric space, a node can compute the distances between each of its neighbors in the network, and the destination whose coordinates are written in the information packet. GF then amounts to forwarding the information to the nodes neighbor closest to the destination in the hyperbolic space. In the experiments on the NDN testbed reported here we tested the modified greedy forwarding (MGF) algorithm that excludes the current node from any distance comparisons and finds the neighbor closest to the destination. The packet is dropped if this neighbor is the same as the packet's previously visited node.
To evaluate the MGF efficiency, we measured the following metrics:
- the success ratio which is the percentage of the successful paths that reach their destinations
- the average stretch of three types:
- Stretch 1 - the standard hop stretch measured on the actual topology is the ratio between the hop lengths of greedy paths and the corresponding shortest paths in the graph. The optimal paths have stretch equal to 1.
- Stretch 2 - measured in the underlying hyperbolic space, the ratio of the length of a successful greedy path to the actual hyperbolic distance between the source and the destination;
- Stretch 3 - measured in the underlying hyperbolic space, the ratio of the length of the shortest path to the actual hyperbolic distance between the source and the destination;
The lower these two hyperbolic stretches, the closer the greedy and shortest paths stay to the hyperbolic geodesics, and the more congruent the network topology is with the underlying geometry. See [HGCN10] for details.
Reading the data
Each experiment has three files associated with it:
- nodes describes the nodes and their polar coordinates in the hyperbolic plane. The format is self-documenting.
- links lists each link as a pair of AS numbers.
-
paths
files contain the forwarding paths between all source-destination pairs.
Each line represents one path between a source-destination pair,
and has the format:
AS1AS2AS3 ... ASN-1ASNoutcome
- AS1 is the source and ASN is the destination.
- AS2 ... ASN-1 are other hops along the path; each is preceeded with a "-" or "+" if the distance to the destination decreased or increased, compared to the previous hop.
- Outcome is either "s" for success, or "f" for failure. If outcome is "f", then ASN-1 is the hop at which the forwarding algorithm gave up.
Experiment 1, August 2011
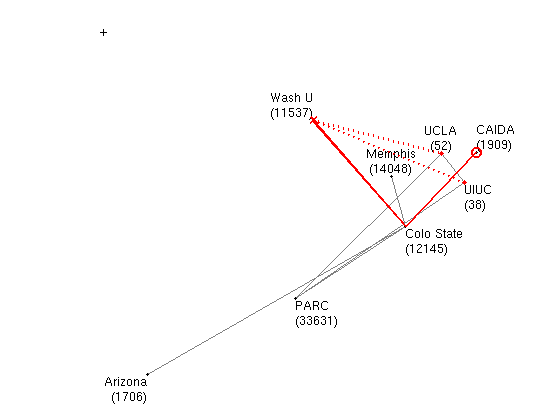
Experiment 1: Original Coordinates
 The origin of the hyperbolic plane is marked by the plus sign.
The two unsuccessful paths from CAIDA are shown in red: the circle is the source,
solid lines are forwarded links, "X" marks the local minimum,
and dotted lines artificially connect the local minimum to the
destinations. All other visualization details are as in Fig. 5 of [HGCN10].
We used the hyperbolic coordinates of the involved ASes given in the supplementary information for the paper, [SIHM10].
Data files: nodes| graph | success ratio | avg stretch 1 | avg stretch 2 | avg stretch 3 | paths |
|---|---|---|---|---|---|
| full graph (links) | 0.7143 | 1.0083 (max 1.3333) | 1.7715 (max 4.1066) | 1.7465 (max 3.1452) | paths |
| link removals | |||||
| 33631-38 (links) | 0.7143 | 1.0000 (max 1.0000) | 1.8605 (max 4.1066) | 1.8605 (max 4.1066) | paths |
| 33631-52 (links) | 0.6786 | 1.0000 (max 1.0000) | 1.7810 (max 3.8571) | 1.7810 (max 3.8571) | paths |
| 52-38 (links) | 0.7143 | 1.0000 (max 1.0000) | 1.8002 (max 3.1452) | 1.8002 (max 3.1452) | paths |
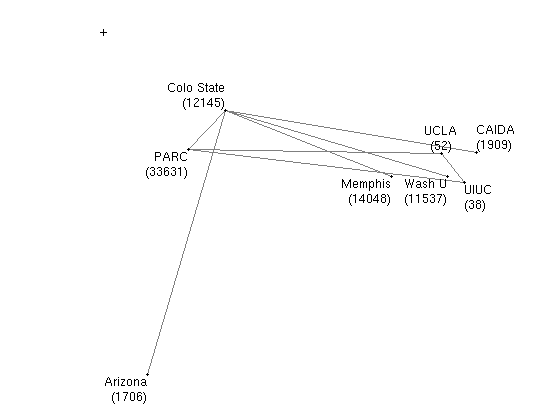
Experiment 1: Adjusted Coordinates
 The origin of the hyperbolic plane is marked by the plus sign.
Since the hyperbolic coordinates we used were constructed for one graph (the measured Internet AS topology) and applied to a different graph (the CCN testbed), the MGF performance is not optimal. To make the underlying hyperbolic space more congruent with the actual testbed topology, we made minor coordinate adjustements: moved the PARC and Colorado State hub nodes closer to the center, and the Washington University leaf node further away from the center.
Data files: nodes| graph | success ratio | avg stretch 1 | avg stretch 2 | avg stretch 3 | paths |
|---|---|---|---|---|---|
| full graph (links) | 1.0000 | 1.0000 (max 1.0000) | 1.4175 (max 2.0340) | 1.4175 (max 2.0340) | paths |
| link removals | |||||
| 33631-38 (links) | 0.8929 | 1.0000 (max 1.0000) | 1.5169 (max 3.0874) | 1.5169 (max 3.0874) | paths |
| 33631-52 (links) | 0.8929 | 1.0000 (max 1.0000) | 1.5344 (max3.1368 ) | 1.5344 (max 3.1368) | paths |
| 52-38 (links) | 1.0000 | 1.0000 (max 1.0000) | 1.4355 (max 2.0340) | 1.4355 (max 2.0340) | paths |
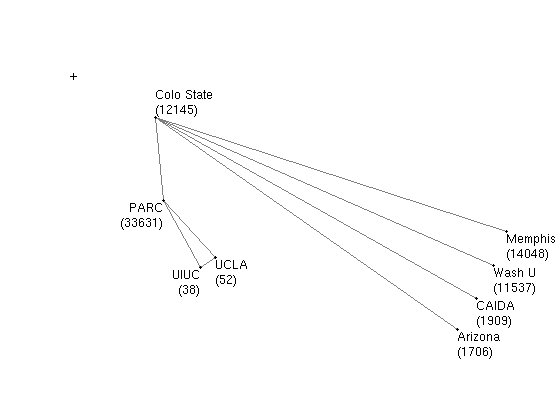
Experiment 1: Manual Coordinates
 The origin of the hyperbolic plane is marked by the plus sign.
Since the testbed graph is so small, we were able to assign the hyperbolic coordinates to the nodes manually such that hyperbolic routing will be 100%-optimal. All the routing performance metric are best possible both in the full graph and in the graphs obtained from it by all possible one-link removals that do no disconnect the full graph.
Data files: nodes| graph | success ratio | avg stretch 1 | avg stretch 2 | avg stretch 3 | paths |
|---|---|---|---|---|---|
| full graph (links) | 1.0000 | 1.0000 (max 1.0000) | 1.0550 (max 1.1944) | 1.0550 (max 1.1944) | paths |
| link removals | |||||
| 33631-38 (links) | 1.0000 | 1.0000 (max 1.0000) | 1.1922 (max 2.8580) | 1.1922 (max 2.8580) | paths |
| 33631-52 (links) | 1.0000 | 1.0000 (max 1.0000) | 1.1951 (max 2.8580) | 1.1951 (max 2.8580) | paths |
| 52-38 (links) | 1.0000 | 1.0000 (max 1.0000) | 1.0578 (max 1.1944) | 1.0578 (max 1.1944) | paths |
Experiment 2, February 2012
We modeled the network growth on the CCN testbed. Specifically, we again assigned to the testbed gateways the hyperbolic coordinates of the ASes obtained in hyperbolic mapping in our paper [SIHM10], and then simulated the network growth as described in [PSGN12] by connecting each node to m=1,2,3 hyperbolically closest nodes. For each value of m, we measured the success ratio and stretches of three types in the resulting networks, as well as in the networks obtained from those by all possible removals of one link and one node.
In summary, all paths in all cases are successful even for small values of m=2 and 3, except for a few unsuccessful paths upon the removal of node 14048 (Memphis), which appears to be the core (highest-degree) node in the resulting network. However, at m=3 the percentage of successful paths is still 94% even with the failure of the Memphis node.
Experiment 2: Growth with m=1
| graph | success ratio | avg stretch 1 | avg stretch 2 | avg stretch 3 | paths |
|---|---|---|---|---|---|
| full graph | 0.5333 | 1 | 1.6804 | 1.6804 | paths |
| link removals | |||||
| 1706-33631 | 0.4000 | 1 | 1.4886 | 1.4886 | paths |
| 12145-14048 | 0.4000 | 1 | 1.6354 | 1.6354 | paths |
| 156-1909 | 0.4889 | 1 | 1.7020 | 1.7020 | paths |
| 299-14048 | 0.4000 | 1 | 1.6404 | 1.6404 | paths |
| 52-156 | 0.4889 | 1 | 1.7020 | 1.7020 | paths |
| 38-14048 | 0.4000 | 1 | 1.6510 | 1.6510 | paths |
| 2552-14048 | 0.4000 | 1 | 1.6424 | 1.6424 | paths |
| 14048-33631 | 0.3111 | 1 | 1.3879 | 1.3879 | paths |
| node removals | |||||
| 1706 | 0.5000 | 1 | 1.4886 | 1.4886 | paths |
| 12145 | 0.5000 | 1 | 1.6354 | 1.6354 | paths |
| 156 | 0.5833 | 1 | 1.7354 | 1.7354 | paths |
| 299 | 0.5000 | 1 | 1.6404 | 1.6404 | paths |
| 52 | 0.6111 | 1 | 1.7020 | 1.7020 | paths |
| 38 | 0.5000 | 1 | 1.6510 | 1.6510 | paths |
| 2552 | 0.5000 | 1 | 1.6424 | 1.6424 | paths |
| 33631 | 0.3611 | 1 | 1.4178 | 1.4178 | paths |
| 14048 | 0.1111 | 1 | 1.2210 | 1.2210 | paths |
| 1909 | 0.6111 | 1 | 1.7020 | 1.7020 | paths |
Experiment 2: Growth with m=2
| graph | success ratio | avg stretch 1 | avg stretch 2 | avg stretch 3 | paths |
|---|---|---|---|---|---|
| full graph | 1 | 1 | 1.6059 | 1.6099 | paths |
| link removals | |||||
| 1706-33631 | 1 | 1.0167 | 1.6569 | 1.6281 | paths |
| 1706-14048 | 1 | 1 | 1.7025 | 1.7064 | paths |
| 12145-33631 | 1 | 1 | 1.6252 | 1.6257 | paths |
| 12145-14048 | 1 | 1.0167 | 1.7484 | 1.7205 | paths |
| 156-14048 | 1 | 1.0074 | 1.7397 | 1.7279 | paths |
| 156-1909 | 1 | 1.0241 | 1.6866 | 1.6354 | paths |
| 299-33631 | 1 | 1 | 1.6245 | 1.6256 | paths |
| 299-14048 | 1 | 1.0167 | 1.7315 | 1.7060 | paths |
| 52-156 | 1 | 1.0056 | 1.6401 | 1.6335 | paths |
| 52-14048 | 1 | 1.0167 | 1.7610 | 1.7292 | paths |
| 52-1909 | 1 | 1 | 1.6420 | 1.6462 | paths |
| 38-52 | 1 | 1 | 1.6437 | 1.6478 | paths |
| 38-14048 | 1 | 1.0056 | 1.7361 | 1.7297 | paths |
| 2552-33631 | 1 | 1 | 1.6247 | 1.6269 | paths |
| 2552-14048 | 1 | 1.0167 | 1.7256 | 1.7014 | paths |
| 14048-33631 | 1 | 1 | 1.7157 | 1.7267 | paths |
| node removals | |||||
| 1706 | 1 | 1 | 1.5761 | 1.5809 | paths |
| 12145 | 1 | 1 | 1.5788 | 1.5795 | paths |
| 156 | 1 | 1 | 1.6236 | 1.6291 | paths |
| 299 | 1 | 1 | 1.5835 | 1.5852 | paths |
| 52 | 1 | 1 | 1.6654 | 1.6709 | paths |
| 38 | 1 | 1 | 1.6046 | 1.6098 | paths |
| 2552 | 1 | 1 | 1.5881 | 1.5928 | paths |
| 33631 | 1 | 1 | 1.6408 | 1.6401 | paths |
| 14048 | 0.4444 | 1 | 1.4240 | 1.4240 | paths |
| 1909 | 1 | 1 | 1.4893 | 1.4947 | paths |
Experiment 2: Growth with m=3
| graph | success ratio | avg stretch 1 | avg stretch 2 | avg stretch 3 | paths |
|---|---|---|---|---|---|
| full graph | 1 | 1 | 1.4049 | 1.4214 | paths |
| link removals | |||||
| 1706-2552 | 1 | 1 | 1.4237 | 1.4397 | paths |
| 1706-33631 | 1 | 1.0056 | 1.4363 | 1.4488 | paths |
| 1706-12145 | 1 | 1 | 1.4238 | 1.4320 | paths |
| 1706-14048 | 1 | 1.0111 | 1.5022 | 1.5153 | paths |
| 156-299 | 1 | 1 | 1.4224 | 1.4353 | paths |
| 156-14048 | 1 | 1.0111 | 1.4827 | 1.5007 | paths |
| 156-1909 | 1 | 1.0111 | 1.4462 | 1.4410 | paths |
| 12145-33631 | 1 | 1 | 1.4246 | 1.4365 | paths |
| 12145-14048 | 1 | 1.0278 | 1.4841 | 1.4478 | paths |
| 299-33631 | 1 | 1 | 1.4235 | 1.4339 | paths |
| 299-14048 | 1 | 1.0333 | 1.4841 | 1.4404 | paths |
| 38-52 | 1 | 1 | 1.4251 | 1.4366 | paths |
| 38-156 | 1 | 1 | 1.4246 | 1.4372 | paths |
| 38-14048 | 1 | 1.0167 | 1.5176 | 1.5076 | paths |
| 52-12145 | 1 | 1 | 1.4218 | 1.4273 | paths |
| 52-156 | 1 | 1.0111 | 1.4485 | 1.4411 | paths |
| 52-14048 | 1 | 1.0111 | 1.4681 | 1.4635 | paths |
| 52-1909 | 1 | 1.0056 | 1.4335 | 1.4382 | paths |
| 2552-33631 | 1 | 1 | 1.4236 | 1.4370 | paths |
| 2552-14048 | 1 | 1.0111 | 1.5152 | 1.5215 | paths |
| 14048-33631 | 1 | 1.0167 | 1.5070 | 1.4970 | paths |
| 1909-14048 | 1 | 1 | 1.4794 | 1.4948 | paths |
| node removals | |||||
| 1706 | 1 | 1 | 1.3944 | 1.4016 | paths |
| 156 | 1 | 1 | 1.4146 | 1.4304 | paths |
| 12145 | 1 | 1 | 1.3956 | 1.4083 | paths |
| 299 | 1 | 1 | 1.3752 | 1.3881 | paths |
| 38 | 1 | 1 | 1.3784 | 1.3973 | paths |
| 52 | 1 | 1 | 1.4146 | 1.4262 | paths |
| 2552 | 1 | 1 | 1.3807 | 1.3989 | paths |
| 33631 | 1 | 1 | 1.4136 | 1.4266 | paths |
| 14048 | 0.9444 | 1.0368 | 1.8166 | 1.7655 | paths |
| 1909 | 1 | 1 | 1.3740 | 1.3899 | paths |
References
- [HGCN10] - D. Krioukov, F. Papadopoulos, M. Kitsak, A. Vahdat, and M. Boguñá. Hyperbolic Geometry of Complex Networks, Physical Review E, v. 82, p. 036106, Oct 2010.
- [SIHM10] - M. Boguñá, F. Papadopoulos, and D. Krioukov. Sustaining the Internet with Hyperbolic Mapping, Nature Communications, v. 1, p. 62, Oct 2010. Contains Supplemental data.
- [PSGN12] - F. Papadopoulos, M. Kitsak, M. Á. Serrano, M. Boguñá, and D. Krioukov. Popularity versus Similarity in Growing Networks, Nature, v. 489, p. 537, Oct 2012.
![Go to CAIDA home page [CAIDA - Center for Applied Internet Data Analysis logo]](/images/caida_globe_faded.png)