Research Activities
Polar Coordinate Outdegree mapping - AS Core
Plotting the positions of Autonomous System (AS) nodes in polar coordinates allows a visualization of the dimensions of peering richness and geographic information, revealing the most highly connected Autonomous Systems. Visualizing the AS Core shows how ISPs connect to form the Internet backbone.
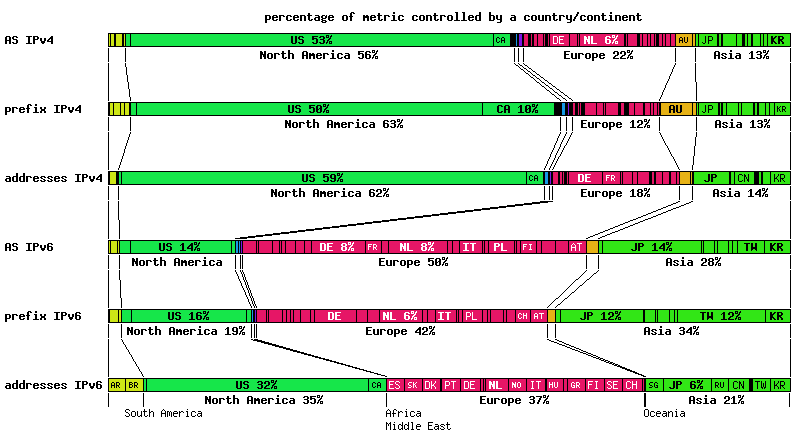
IPv4 and IPv6 BGP Geopolitical Analysis
The worldwide distribution of Internet resources and address space is highly non-uniform. We present an analysis comparing five demographic measures against three measures of Internet resources, stratified by continent with substratification by country, in both IPv4 space and IPv6 space.
Correlation between country governance regimes and the reputation of their Internet (IP) address allocations
We analyzed the reputation of a country's Internet (IPv4) addresses by examining the number of blacklisted IPv4 addresses that geolocate to a given country. We compared this indicator with two qualitative measures of each country's governance. We found a correlation exists between perceived corruption and fraction of blacklisted IP addresses.
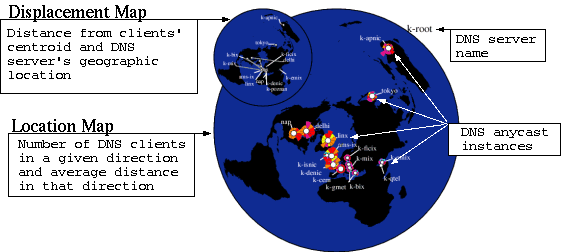
Geographic Influence Map
The Influence Map of DNS Root Anycast Servers shows the geographic distribution of DNS clients for anycast instances. Geographic data are shown on a pair of maps, both of which show the world as viewed from the North Pole. This technique shows the weighted center of a geographically distributed group with colored wedges indicating the number of group members in a given direction.
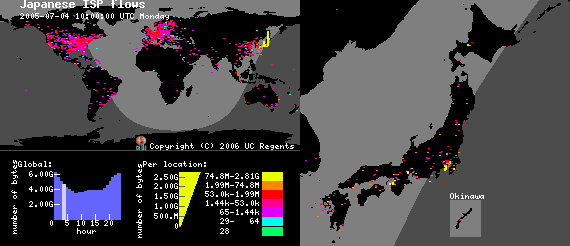
Diurnal and Geographical Animations - Cuttlefish
Cuttlefish simultaneously displays diurnal and geographical data patterns, illustrating the relationship between local time and the visualized events. The tool clearly depicts the time of day at a given geographic region by animating the sun's shadow moving across a world map.
3D Hyperbolic Geometry - Walrus
The Walrus tool uses 3D hyperbolic geometry to display graphs under a fisheye-like distortion, providing an interactive visualization of large directed graps in three-dimensional space. The amount of magnification, and thus the level of visible detail, varies across the display. This technique allows the user to examine the fine details of a small area while always having a view of the whole graph as a frame of reference.
Publications
Resources
Resources on graph drawing:
- Graph Drawing. A starting point for graph drawing. It includes a bibliography and links to research groups, tools, conferences, and selected papers.
- Graph Visualization and Navigation in Information Visualization. A survey paper on techniques for visualizing graphs, especially from the perspective of information visualization.
- Fractal Approaches for Visualizing Huge Hierarchies. A paper discussing a fractal-based tree layout algorithm.
- Layout Options for Large Internet Graphs
![Go to CAIDA home page [CAIDA - Center for Applied Internet Data Analysis logo]](/images/caida_globe_faded.png)


