![[CAIDA - Center for Applied Internet Data Analysis logo]](/images/caida_globe_faded.png "Go to CAIDA home page")
List of Applet Parameters for GeoPlot continues with parameter:data below.
GeoPlot is considered a deprecated tool and is not any longer supported by CAIDA. These pages are made available for historical purposes.
List of Parameters (cont'd)
- mapname
- bgcolor
- fgcolor
- title
- date
- default_node_size
- default_line_size
- default_node_color
- default_line_color
- default_font_size
- refresh_interval
- hide_key
- top_lat
- top_lon
- bot_lat
- bot_lon
- color_key
- size_key
- data
| Parameter : data |
The data parameter is used to define the nodes and lines that need to be plotted. This can either be an URL to a data file containing all the definitions in the specified format or in the applet tag itself. All node and line definitions must be terminated by a semi-colon.
NODES
Syntax :
| Field 1 | Field 2 | Field 3 | Field 4 | [Field 5] |
| n/N | key | latitude | longitude | Optional Description String |
Field 1 : this field tells GeoPlot that your defining a node.
Field 2 : this field must uniquely identify each node, any unique identifier can be used.
Field 3 : latitude of the node.
Field 4 : longitude of the node.
Field 5 : the table below shows the optional attributes that can be specified for each node.
| t: | title |
| sz: | diameter of node |
| vc: | color value that is matched against color key |
| vs: | size value that is matched against size key |
| cl: | color of node |
| u: | URL to open when clicked on |
| d: | description that is shown in status bar when mouse is over node |
Placement of Title :
GeoPlot automatically places the title in the best possible location around the node, best refers to the area where there is the least number of lines connected to the node. The user also has the option of overriding this placement and specifying their own location. This is defined as a value following the title seperated by a comma. Commas can be placed in the title, this will not affect the final location attribute if there is one.The values correspond to the quadrant diagram shown below with the circle in the center representing the node.
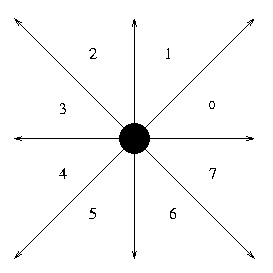
| 56 | title appears centered between quadrants 5 and 6 |
| 21 | title appears centered between quadrants 1 and 2 |
| 70 | title appears centered between quadrants 0 and 7 |
| 43 | title appears centered between quadrants 3 and 4 |
| 0 through 7 | title appears begining or ending in their respective quadrant |
| Example: |
| n CN 38.00 105.00 d:This was the 1st node definition; |
| n US 38.00 -98.00 t:USA,70 d:This was the 2nd node definition u:http://www.aciri.org; |
| n RO 46.00 25.00 d:This was the 3rd node definition; |
| n CA 60.00 -96.00 t:Canada cl:rgb-0-255-0 d:This was the 4th node definition; |
LINES
Syntax :
| Field 1 | Field 2 | Field 3 | [Field 4] |
| l/L | source key | destination key | Optional Description String |
Field 1 : this field tells GeoPlot that your defining a line.
Field 2 : source node
Field 3 : destination node.
Field 4 : the table below shows the optional attributes that can be specified for each node.
| t: | title |
| sz: | width of line |
| vc: | color value that is matched against color key |
| vs: | size value that is matched against size key |
| cl: | color of line |
| u: | URL to open when clicked on |
| d: | description that is shown in status bar when mouse is over line |
| r: | direction of arrow |
Types of Lines :
There are three kinds of lines that can be drawn between nodes. The simplest is just a single line between the source node and the destination node. Lines can also be drawn with both the source and the destionation referring to the same node. Such lines are depicted as circles and there can be more than one of these definitions. The maximum for a single node is 24 lines going to itself. There can be any number of lines between a pair of nodes and their definitions don't have to be together in a single block. All the indiviual lines between the nodes are drawn seperately and there is no aggregation.
Placement of Title :
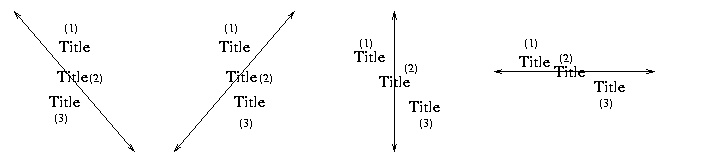
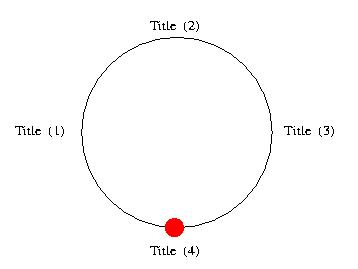
By default GeoPlot places the title of a line at the locations marked 3 in the diagram above. The user can override this by specifying their own location. This is defined as a value following the title seperated by a comma. Commas can be placed in the title, this will not affect the final location attribute if there is one. In the case of circles which represent links between the same source and destination node, titles are placed by default at location 2 in the diagram shown below and there is an additional value '4' that can be specified.
Direction of Arrow :
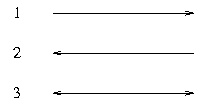
By default arrows are not drawn on lines. They must be specified with the r attribute and can take any of the three values described below. Arrows are not marked on links starting and ending at the same node.
| 1 | arrow at destination end of line |
| 2 | arrow at source end of line |
| 3 | arrow on both ends |
| Example: |
| l US AU vc:0.15 vs:25 d:Fat pipe USA-AUS u:http://www.cnn.com; |
| l US AU vc:0.025; |
| l AU US; |
| l AU US vc:0.045; |
| l AU US cl:rgb-255-0-255; |
| l BR BR vc:0.015 vs:25; |
| l US BR vc:0.025 r:3 t:USA-BRAZIL,1; |
| Colors |
There are thirteen colors that can be expressed in words. They are listed below:
| black | |
| red | |
| blue | |
| cyan | |
| darkGray | |
| gray | |
| green | |
| lightGray | |
| magenta | |
| orange | |
| pink | |
| white | |
| yellow |
Colors can also be expressed as a RGB value.
Syntax :rgb-r-g-b
All values have to be expressed in decimal form
| r | red component |
| g | green component |
| b | blue component |
| Using Latitude and Longitude |
This picture shows how latitude and longitude usually appear on a map. The red line is the equator. All the latitudes above the equator are North latitudes, and those below are South latitudes The blue line is the Prime Meridian. The meridians to the left of the blue lines are West longitudes, and those to the right are East Longitudes.
If this were a graph in math class, you would read the bottom numbers (the X axis) first. This may seem odd, but maps are different.On a map you must read the side first to determine the latitude, and then the bottom last to determine the longitude. South latitudes and West longitudes should be specified as negative values to GeoPlot.
Explanation taken from: http://www.acs.ucalgary.ca/~dmjarvey/tutorial