These screenshots and animations are simply intended to give a feel for
what visualization and navigation in Walrus are like. The data shown are
not necessarily meaningful in themselves.
Click on a thumbnail for the larger version.
Skitter Monitors
champagne (9,175 nodes and 15,519 links)
riesling (54,893 nodes and 79,409 links)
lhr (535,102 nodes and 601,678 links)
CVS Repository (18,474 nodes and 18,473 links)
Various Directory Trees
![[img]](lar-gr-l-1-tn.png)
![[img]](lar-gr-l-13-tn.png)
![[img]](lar-gr-l-7-tn.png)
![[img]](med-gr-l-4-tn.png)
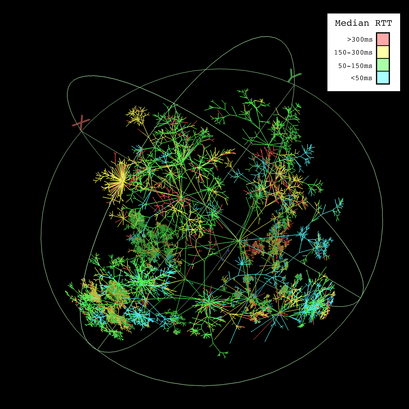
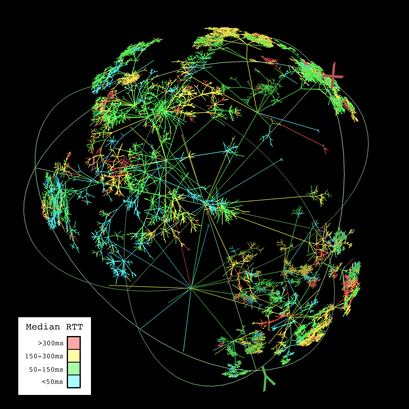
Round-Trip Time Measurements (63,631 nodes and 63,630 links)
A description of this data is available.
CodeRed Infections (321,986 nodes and 321,985 links)
A description of this data is available.
Animations
These animated GIFs show graph navigation in Walrus. Click on a thumbnail to load.
![[img]](lhr-anim-thumb.png) The lhr skitter monitor. [3.0MB]
The lhr skitter monitor. [3.0MB]
![[img]](ries-anim-thumb.png) The riesling skitter monitor. [3.7MB]
The riesling skitter monitor. [3.7MB]
![Go to CAIDA home page [CAIDA - Center for Applied Internet Data Analysis logo]](/images/caida_globe_faded.png)
![[img]](champ2-thumb.png)
![[img]](ries-t5-thumb.png)
![[img]](ries-t-thumb.png)
![[img]](ries-t-b-thumb.png)
![[img]](ries-t-c-thumb.png)
![[img]](ries-t2-thumb.png)
![[img]](lhr-old-thumb.png)
![[img]](lhr-nt2-thumb.png)
![[img]](lhr-nt3-thumb.png)
![[img]](lhr-t3-thumb.png)
![[img]](cvs2-thumb.png)
![[img]](cvs3-thumb.png)
![[img]](cvs6-thumb.png)


![[img]](wobble-thumb.png)
![[img]](ries2-anim-thumb.png)
![[img]](xmas-snow2-tn.png)
![[img]](xmas3-tn.png)