
otp-ro
Evolva Telecom
Bucharest, RO
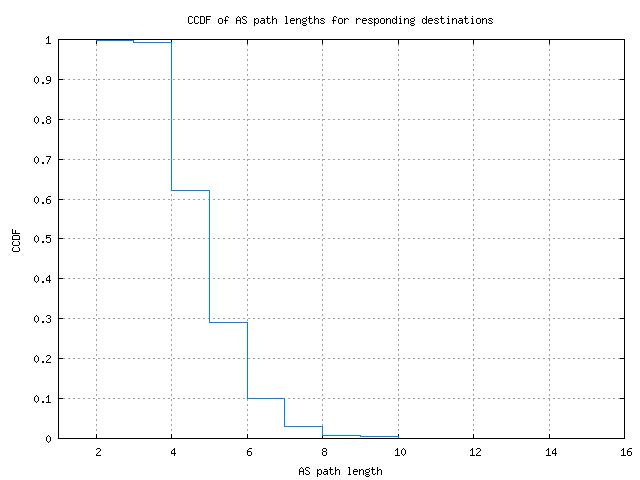
CCDF of AS path lengths for responding destinations
-
|
|---|
| percentile |
10th |
25th |
50th |
75th |
90th |
Max |
| AS path length |
4 |
4 |
5 |
6 |
7 |
15 |
Use the following link to download the data used to render this graph in ASCII, comma-separated values format here: (
CSV output)
Description
This graph shows the complementary cumulative distribution function (CCDF)
of AS path lengths (number of Autonomous Systems) to a destination that
responds to probing.
Motivation
By showing the distribution of AS path lengths to all responding
destinations, we can get a sense of how closely connected a monitor is to
the 'core' of the Internet.
Background
The complementary cumulative distribution function shows the fraction of
collected data points that are greater than a given value. This is
backwards from how percentiles are given, as those show the percentage
lower than a given value. On this graph, you would find the 80th
percentile at the 0.2 Y value. The AS path length is defined as the number
of ASes a probe transits to reach the destination from the Ark monitor.
These values are only used when a response has been received from the
destination. In other words, incomplete paths are ignored for the purposes
of determining AS path length.
Analysis
Because most AS path lengths fall within a relatively short range, the CCDF
graphs will tend to have a sharp drop off around the median. A lower
median value of AS path length likely indicates that a monitor is closer to
tier 1 or tier 2 providers, as it doesn't have to go through many ASes to
reach its destinations.